


Banner image credit @nublson on Unsplash.
Blues University is an ongoing series of articles geared towards beginner- and intermediate-level developers who are looking to expand their knowledge of embedded development and the IoT.
Debugging is the backbone of the development process — and effective debugging is crucial when developing embedded systems. Having processes in place to identify and rectify intricate hardware and software issues ensures your embedded systems perform optimally and reliably. For embedded systems developers, honing your debugging skills becomes even more crucial as your applications grow more complex.
This tutorial demonstrates how to perform debugging in the STM32 microcontroller ecosystem — a versatile platform that has carved a prominent niche in the embedded development landscape. There are many STM32 microcontrollers available, tailored to address diverse embedded application needs spanning performance, memory, and I/O requirements. Their architecture, peripherals, and support for different communication protocols make them well-suited to sophisticated embedded solutions. Moreover, the STM32 ecosystem provides several debugging tools and resources, including the STLink debugger.
The following sections provide a comprehensive overview of debugging in STM32 microcontroller-based applications. We'll discuss debugging techniques, advanced debugging tools, and some common debugging scenarios.
By taking a systematic approach to debugging, you can harness the full potential of STM32 microcontrollers, gain a deeper understanding of your code, and increase the reliability and performance of your embedded applications.
Understanding the STLink Debugger
The STLink debugger, crafted by STMicroelectronics, streamlines debugging and programming — things essential for delivering efficient, bug-free embedded solutions.
Introduction to STLink
An STLink isn't just another debugging and programming tool: It's the key to creating robust and efficient embedded applications with STM32 microcontrollers. Serving as a bridge between your workspace and the STM32 microcontroller, STLink simplifies code transfer onto these microcontrollers. This seamless integration supports a smooth and efficient debugging experience. STLink also facilitates real-time interaction with the microcontroller as the code executes, helping you mitigate bugs as soon as possible.
Moreover, STLink's integration within popular integrated development environments (IDEs) further simplifies programming and debugging STM32 microcontrollers directly from your preferred development environment, streamlining your workflow and boosting productivity.

When to Consider Using an STLink
In the early stages of your project, effective debugging is vital. Because you're laying a solid foundation and implementing core functionalities, you need to prevent minor issues from escalating into major problems later. And since the early-stage development phase often involves rapid prototyping and testing, consistently testing systems for bugs decreases the chances of performance-impacting bugs slipping through.
STLink's real-time debugging capabilities are invaluable here. Its immediate feedback loop accelerates this iterative process, helping you promptly validate your assumptions and make adjustments as needed.
Then, as your project progresses, you'll likely encounter issues that demand a meticulous analysis of the system's behavior. Whether fixing hard-to-replicate bugs, overcoming performance bottlenecks, or optimizing the system for better efficiency, STLink empowers you to delve deep into the system to unearth invaluable insights.
STLink provides a comprehensive understanding of a system's behavior under various conditions by monitoring memory, registers, and system states. This insight is crucial for swift troubleshooting, letting you precisely pinpoint the root causes of issues. Moreover, STLink's detailed system insights are indispensable for optimizing resource use and ensuring optimal system performance.
Advantages of Using STLink
STLink's tailored support for STM32 microcontrollers simplifies numerous tedious tasks within your development workflow, enhancing efficiency. This efficiency, in turn, frees you to focus on problem-solving, accelerating your overall development process.
Furthermore, STLink's real-time memory and register monitoring features enable you to monitor memory and register values as the program executes, gaining live insights into the system's operation.
Limitations and Challenges
While STLink is a powerful ally in embedded development, it has a couple of limitations to keep in mind:
- Speed constraints — In complex projects with large codebases, STLink might experience reduced speeds, leading to communication delays between the debugger and the microcontroller. This speed constraint becomes especially noticeable during code stepping or real-time monitoring of memory and register values, making debugging cumbersome and time-consuming. To address this challenge, employing a well-structured debugging approach that prioritizes critical sections of code for debugging can significantly enhance efficiency.
- Restricted compatibility — Another limitation is ST's restricted compatibility with third-party toolchains. This constraint might steepen your learning curve, especially if you're accustomed to other ecosystems. You might need to explore alternative configurations or tools to ensure a seamless workflow, especially when integrating STLink into a diverse toolchain ecosystem.
Using the STLink Debugger
Let's look at how to use the STLink debugger to debug a simple program on an STM32 microcontroller. For this example, we're using the PlatformIO extension for VSCode, a popular IDE for STM32 development that integrates STLink support.
Prior to debugging the program, you'll need to know how to load a program onto the STM32 host. The next few steps will demonstrate this.
Prerequisites
To follow along with this demonstration, ensure you have the necessary prerequisites:
- STM32 microcontroller board (this example uses the Blues Swan).
- STLink/V3 debugger.
- VSCode with the PlatformIO extension installed on your computer.
Set Up Hardware
Connect the STLink V3 debugger to the STM32 board and your computer using the JTAG/SWD connector included with the STLink Debugger. If you're using a Swan board, it connects to the port highlighted in the image below:

You also need to connect a power supply to the board in one of three ways. You
can power the board directly via the micro USB connection. Or, manually feed
power to the board by supplying voltage to the appropriate pin (for the Blues
Swan board, it's the VIN pin located at the top left-hand side of the board in
the photo — see the datasheet for
details). Alternatively, use the power connection at the socket in the top-right
of the photo. Make sure you have the correct voltage for your particular
development board.
Create a New Project
First, launch Visual Studio Code (VSCode).
From the home screen, click on the PlatformIO button on the left-hand side of the IDE.

This will bring up a PlatformIO window. Here, select Create New Project.

This action brings up the PlatformIO IDE extension, where you can create the project by clicking New Project.

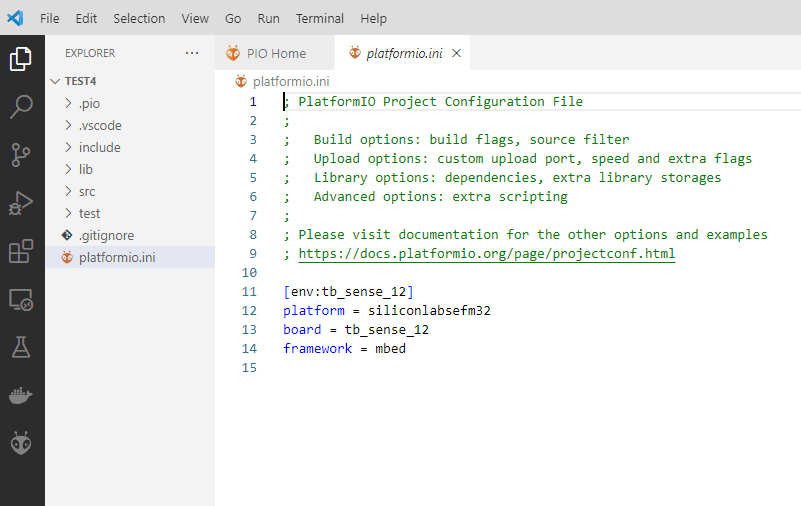
This action brings up the New project wizard, prompting you to name your project and choose the board, framework, and other debugging parameters. Different boards allow you to use different frameworks. For this demonstration, choose Blues Swan with the Arduino framework. Since STM32 boards are compatible with the Arduino framework, it's advisable for newcomers to learn this approach.

Click Finish, and your project will now initialize. This will likely take a few minutes. Once finished, you'll have a project ready to develop.
Write a Simple Program
Navigate to the project explorer, where you should see a project folder with a series of sub-folders. The sub-folder should look like this:
Right-click the folder labeled "src" and select Create new file. Name the
file main.cpp, or something similar. This is where you'll place the code.
To keep things simple, use the code below to create a basic program that toggles the LED on the development board flash on and off:
// the setup function runs once when you press reset or power the board
void setup()
{
  // initialize digital pin LED_BUILTIN as an output.
  pinMode(LED_BUILTIN, OUTPUT);
}

// the loop function runs over and over again forever
void loop()
{
  digitalWrite(LED_BUILTIN, HIGH); // turn the LED on (HIGH is the voltage level)
  delay(1000);                     // wait for a second
  digitalWrite(LED_BUILTIN, LOW);  // turn the LED off by making the voltage LOW
  delay(1000);                     // wait for a second
}
Copy and paste this code inside your main.cpp file.
Build the Project
To compile the project, click PlatformIO Build, which is the check mark located in the bar at the bottom.

The terminal at the bottom of the IDE will display the process and results of the build:

Run the Code
Click run > run to run the program on the development board. If there are no errors, you should see the LED on your development board flash on and off.
You are now able to debug this simple program in the IDE by making changes and checking results. The program runs on your board, but the IDE allows you to easily debug the program.
We'll take a deeper dive into debugging with PlatformIO a bit later.
Other Debugging Options
There are several other debugging options apart from the STLink debugger, each offering unique features. This section explores on-chip debuggers, print-based debugging, and hardware tools like oscilloscopes and logic analyzers.
On-Chip Debuggers
On-chip debuggers are critical for developing and troubleshooting software for microcontrollers and other embedded systems. They leverage hardware features integrated into the microcontroller, granting you direct, low-level access to the device.
Connection interfaces like Joint Test Action Group (JTAG) or Serial Wire Debug (SWD) let you execute operations like setting breakpoints, stepping through code, inspecting memory and register values, and managing the program's execution flow. This direct interaction with the microcontroller's resources enables precise monitoring and manipulation of its behavior, allowing you to diagnose complex issues in your embedded systems.
On-chip debuggers are particularly useful because they enable real-time debugging within the actual hardware environment, providing a realistic picture of system performance. They're invaluable when your embedded system interacts with specific hardware peripherals or involves time-critical functions that are challenging to replicate in a simulated environment.
Pros:
- Integrated — On-chip debuggers integrate seamlessly within the microcontroller, eliminating the need for additional hardware.
- Cost-effective — They don't require extra hardware, making them more cost-efficient.
Cons:
- Limited features — They might offer fewer features compared to external debuggers like STLink.
- Compatibility — Compatibility with various IDEs and toolchains may vary.
Print-Based Debugging
Print-based debugging is a straightforward and effective method for troubleshooting embedded applications, especially in environments where sophisticated debugging tools aren't available or suitable. This technique involves embedding print statements within the code to output data to a console or log file when the program runs. These print statements display variable values, program execution flow, and error messages, offering insights into the application's behavior.
In embedded systems, the output typically goes to a serial console or similar interface, allowing real-time observation of the program's operation. Print-based debugging is especially useful for detecting logical errors, tracking variable states across different program components, and understanding function call sequences.
However, print-based debugging has some limitations. It can be intrusive, as it requires modifying the source code. Additionally, it might hinder the application's performance and timing, especially in time-sensitive embedded systems. Despite these drawbacks, print-based debugging remains popular due to simplicity and effectiveness, particularly where more complex debugging tools aren't feasible or necessary.
Pros:
- Approachability — Print-based debugging doesn't require special hardware or complex setup, making it accessible and approachable for developers of all skill levels.
- Universality — It's applicable in nearly any development environment and with various programming languages.
Cons:
-
Intrusive — It requires modifying the source code, which can be cumbersome and introduce new issues.
-
Limited insight — Unlike on-chip debuggers, print-based debugging lacks in-depth visibility into the system's state, such as memory and register contents.
Oscilloscopes and Logic Analyzers
Oscilloscopes and logic analyzers are important tools for embedded systems development, offering in-depth insights into the embedded system application's electrical and timing characteristics.
Oscilloscopes visualize and analyze the analog waveforms of electrical signals, presenting a dynamic view of voltage changes over time. They're essential for troubleshooting signal integrity, noise, and timing in circuits. Additionally, oscilloscopes are particularly valuable for analyzing communication protocols, power supply stability, and sensor output.
Logic analyzers, on the other hand, capture and simultaneously display multiple digital signals. They illustrate the exact sequence of digital events, correlating them with the system's behavior. This capability is invaluable for debugging complex digital interfaces like SPI, I2C, and UART communications.
Pros:
- Detailed analysis — Both tools offer detailed, real-time insights into the electrical behavior of embedded systems, vital for diagnosing hardware-related issues.
- High precision — They provide high precision and can capture transient events that might evade other debugging methods.
Cons:
- Cost and complexity — These tools can be expensive and require expertise to operate effectively, making them less accessible for hobbyists or small-scale developers.
- Limited to hardware analysis — While extremely effective for hardware debugging, they don't provide direct insights into software logic or program execution.
Selecting a Debugging Method
Understanding the strengths and weaknesses of these debugging alternatives is crucial for making informed decisions based on your project's requirements. On-chip debuggers and print-based debugging are simple and cost-effective but may lack features. Oscilloscopes and logic analyzers are more complex and potentially expensive. However, they provide detailed insights into system behavior, which is invaluable when addressing complex issues in embedded systems.
Making a choice tailored to your project's needs and budget can increase debugging efficiency, contributing to the success of your embedded system project.
Step Debugging in Visual Studio Code
Step debugging in VSCode is an effective method for troubleshooting and understanding code behavior in real time, giving you in-depth information for debugging embedded applications. Let's explore how to set up and perform step debugging for STM32 development.
Debugging an Actual Application
To demonstrate, create a program that expands on the earlier LED switching application. The following code includes variables that perform an addition operation and flash the LED to display the answer:
#include <stm32f1xx.h>

void SystemClock_Config(void);
static void MX_GPIO_Init(void);

void setup()
{
    pinMode(LED_BUILTIN, OUTPUT);
}

// the loop function runs over and over again forever
void loop()
{
    int a = 2;
    int b = 3;
    int sum = a + b;  // Calculate the sum of a and b

    //Flash sum times, then delay for 10 seconds.
    for(int i=0;i<sum;i++){
        digitalWrite(LED_BUILTIN, HIGH); // turn the LED on
        delay(1000);                     // wait for a second
        digitalWrite(LED_BUILTIN, LOW);  // turn the LED off
        delay(1000);                     // wait for a second
    }

    delay(10000);
}
Breakpoints, Watchpoints, and Tracepoints: Step Debugging
A breakpoint halts the program at a specific point, allowing you to inspect the application's state. To set a breakpoint, open the source file and click in the left margin next to the line number where you want the breakpoint.

A tracepoint is similar to a breakpoint but performs an action — like logging a message or evaluating an expression — without pausing the execution. Adding tracepoints enables you to monitor the application's behavior and gather diagnostic information without interrupting the execution flow.
Editing breakpoints offers three advanced options: Expression, Hit Count, and Log Message, each tailored to refine the debugging process. You can access them by creating a breakpoint, right-clicking on it, and selecting Edit Breakpoint.

After doing so, you're greeted with a menu that allows you to select your custom action.
The Expression option lets you establish a conditional breakpoint based on a specific criterion, triggering the breakpoint only when the given condition or expression evaluates to true. This is particularly useful in scenarios like monitoring a variable's value within a loop or a function and pausing execution only under certain conditions.
Conversely, the Hit Count option determines how many times a breakpoint must be encountered before it becomes active. This feature is invaluable when dealing with code executed repeatedly, enabling the debugger to pause only after the breakpoint has been hit a specified number of times — thus avoiding frequent and unnecessary pauses.
Lastly, the Log Message option is designed for scenarios where you wish to log a message to the console each time the breakpoint is hit, without halting your program execution. This is useful for logging dynamic expressions evaluated at runtime, providing insights into the program's behavior at different execution points. Together, these options enhance the debugging process's flexibility and effectiveness in VSCode, enabling more targeted and efficient debugging strategies.
The image below demonstrates how to set a tracepoint that logs "a is 3 now" if
a is equal to 3 at the breakpoint:

Starting a Debug Session
To start the debug session, click the debug icon in the activity bar and then the green triangle at the top to start debugging. This action will build and run your application.
Analyzing Runtime Behavior: Stack, Registers, and Memory Inspection
There are three different ways to check variable values while debugging the
program, all of which require you to stop at a breakpoint. The first — and most
consistent — method involves hovering your mouse over a variable. The variable's
value will appear directly above it. For example, if you hover over the b
variable, you can observe its value is 2, as shown below:

The second method involves checking the variables tab in the top left-hand corner of the IDE, as shown below:

Here, the display shows variable values categorized into three types: Local, Global, and Static. Local variables, defined within a function or scope, allow accessibility only in their specific context and are crucial for tracking function-level operations. In contrast, global variables, defined outside of any function, are accessible from anywhere in the code, providing a broader scope of influence and persistence throughout the program's runtime. Lastly, static variables, while similar to local variables in scope, retain their value between function calls, enabling them to preserve state information across multiple invocations of a function.
Depending on your application's current state, the local variables you want to check may no longer appear under the variables tab. Once the current scope is left, the definition of local changes and so do the variables shown. To follow a variable regardless of the context of your running application, you need to employ the third method of checking variables — add to watch.
To add a variable to the watch bar, right-click the variable and select Add to Watch, as shown below:

In this example, you add the variable "sum" to the watch list. Once this is
done, you can always check this variable's current state by looking at the watch
tab, which is located directly below the variables tab:

Additionally in the Debug sidebar, you can check the CALL STACK and VARIABLES (Registers) sections to examine the current stack state.
The call stack provides key insights into your application, including:
- Function call hierarchy — The call stack lists the sequence of function calls leading to the current execution point, with the most recent at the top. This includes functions defined in your application, along with library or system calls.
- Source file and line number — For each function call, the call stack shows the source file name and line number. This helps locate the exact point in the source code for each function call.
- Local and global variables — When a function in the call stack is selected, it displays the state of local variables within that function context, including primitive types, objects, and pointers. The call stack reflects their values at the moment of the application's pause.
- Thread information — For multithreaded C++ applications on the development board, the call stack will show separate stacks for each thread. This is essential for debugging issues related to concurrency and threading.
With this configuration, you're equipped to navigate your STM32 applications in VSCode, inspecting variables, the stack, and registers to understand your code and pinpoint any bugs or anomalies. This powerful setup fosters a deeper understanding of your code's runtime behavior and significantly accelerates debugging.
Exploring Real-Time Tracing with Serial Wire Output
The complexity of embedded systems, especially those based on STM32 microcontrollers, often necessitates advanced debugging techniques. Real-Time Tracing with Serial Wire Output (SWO) is a pivotal method in this context. This section explores why SWO is important, how it works, its advantages, and potential drawbacks, followed by a detailed guide on its implementation using PlatformIO in VSCode.
Why Use SWO
SWO provides a window into the real-time functioning of your microcontroller. It works by transmitting trace data through a dedicated pin, offering insights without halting the processor. This feature is particularly useful in scenarios requiring:
- Real-time monitoring: Observing system behavior under actual operating conditions is crucial.
- Performance analysis: Identifying bottlenecks and timing issues without disrupting the system's real-time operation ensures smooth operation.
How SWO Works
SWO is a vital component in modern microcontroller debugging. It functions as a dedicated channel for data transmission, playing a crucial role in the communication between a microcontroller and a debugging tool. This feature of SWO is particularly important for transmitting a variety of data from the microcontroller, including variable values offering insights into the state of the program at any given time, execution traces that provide a step-by-step account of the program's operation, and system logs essential for understanding the systems' overall behavior.
The ability to access this information is invaluable, as it allows you to monitor the internal processes of your applications in real time, facilitating a deeper understanding and more efficient debugging.
Moreover, SWO stands out for its non-intrusive nature, distinguishing it from other debugging methods like breakpoints. While breakpoints pause the microcontroller for data inspection, SWO operates without interrupting the microcontroller's ongoing processes. This non-intrusive approach ensures a continuous and uninterrupted flow of data. It's particularly beneficial in scenarios where stopping the microcontroller is infeasible or might impact the behavior being debugged. You can observe the system's behavior under real operating conditions, gaining a deeper understanding of its performance and potential issues. These aspects make SWO an indispensable tool for embedded system development, offering both depth and continuity in system monitoring and debugging.
Pros and Cons of SWO
Pros:
- Real-time insights without halting the system
- Enables monitoring of specific variables and events
- Useful for understanding timing and performance issues
Cons:
- Limited by the bandwidth of the SWO pin, affecting the amount of data that can be transmitted
- Requires compatible hardware and initial setup effort
Implementing SWO with PlatformIO in VSCode
Assuming PlatformIO and its prerequisites are already installed and your hardware is compatible with SWO:
- Configure SWO in platformio.ini
- Define SWO-specific settings like trace frequency, which should match the core clock of your STM32.
- Enable specific channels for tracing. For instance, you might want to trace system calls or variable changes.
- Insert macros or function calls at strategic points in your code. PlatformIO will use these as hooks to send data via SWO.
- Launch your debug session in VSCode using PlatformIO. This streams the SWO data to a dedicated console or window in VSCode, where you can view real-time variable values, function calls, or log messages as the system operates.
Debugging Communication Protocols with SWO
Debugging communication protocols is a critical aspect of embedded system development, particularly for STM32 boards. Effective communication is the backbone of most embedded systems, whether it's for sensor data collection, control signal transmission, or network-based communication. Issues in communication protocols can lead to data loss, corruption, or system malfunctions, making debugging a high priority.
Debugging communication protocols is often necessary when:
- Implementing new protocols: When you're implementing new communication protocols, it's vital to verify secure data transmission and receipt.
- Integrating systems: When integrating different modules or systems, it's essential to ensure seamless communication between them.
- Resolving data transmission issues: This is important for addressing anomalies in data transmission, such as delays, losses, or corruption.
To effectively use SWO for debugging communication protocols, follow these steps:
- Variable monitoring setup: Identify and select key variables involved in the communication process, such as buffer sizes, data counters, or error flags. Configure SWO in PlatformIO to monitor these variables. This setup is crucial for gaining visibility into the protocol's inner workings.
- Real-time variable tracking: During a debug session, observe the selected variables' values in real time. PlatformIO and SWO let you track how these variables change as the system operates, providing insights into the protocol's behavior. This real-time monitoring helps uncover issues like timing discrepancies, unexpected variable states, or irregularities in data handling, which are often challenging to detect through conventional debugging methods.
By focusing on the critical aspects of the communication protocol and leveraging the capabilities of SWO, you can diagnose and resolve complex issues more efficiently, ensuring robust and reliable communication in your embedded systems.
Common STM32 Debugging Scenarios
Embedded system development often involves navigating low-level hardware interactions, leading to intricate and elusive issues. Below are some common debugging scenarios encountered in STM32 development.
Interrupt Issues
Managing interrupts is crucial for handling asynchronous events in embedded systems. Challenges may include interrupt storms, missed interrupts, or incorrect handling due to misconfigurations or bugs. To identify these issues, use debugging tools to monitor for interrupt flags and check the interrupt vector table to ensure the correct assignment of interrupt handlers.
Then, to resolve these issues, correct misconfigurations, set interrupt priorities appropriately to avoid priority inversion problems, and verify the logic within your interrupt handlers.
Clock Configuration and Startup Errors
Incorrect clock configurations in embedded systems can lead to instability or malfunctions, so it's imperative to set them up accurately. Identifying errors involves using a debugger to step through the startup code, ensuring the clock configuration aligns with the microcontroller's datasheet specifications.
Additionally, use oscilloscopes to measure the actual clock signals. To fix these issues, correct any identified clock configuration errors in the startup code or use STMicroelectronics configuration tools, such as STM32CubeMX.
Memory Corruption: Techniques to Pinpoint the Culprit
Memory corruption in embedded systems can manifest as erratic behavior, crashes, or data loss, and pinpointing the cause is essential for system stability. You can identify memory corruption in several ways. Use bounds-checking tools to unveil buffer overflows and memory profiling tools to spot unexpected memory usage patterns. Set up watchpoints on suspected memory locations to catch unwanted modifications.
To address these issues, fix identified buffer overflows and incorrect memory accesses. Additionally, prevent future corruption by ensuring you have proper memory initialization and are using pointers correctly.
Addressing These Scenarios
Addressing these common debugging scenarios requires a solid understanding of the STM32 microcontroller and a systematic approach to issue identification and resolution.
The debugging tools and techniques discussed in the previous sections enable you to navigate these other challenges efficiently. Moreover, continuous monitoring, analysis, and verification are essential for ensuring system integrity, robustness, and reliability, even when faced with complex issues.
Best Practices for Debugging STM32 Applications
Debugging embedded systems, particularly those built around sophisticated microcontrollers like STM32, demands a disciplined, structured approach. Let's explore some best practices to follow when debugging STM32 applications.
Adopting a Systematic Approach: The Importance of Reproducibility
Reproducibility is a cornerstone of effective debugging. Being able to reproduce an issue lets you observe problems under controlled conditions. Always carefully document the steps and conditions of that issue, plus any relevant settings. Additionally, isolating the issue by simplifying the system or code to the smallest reproducible example is essential. This systematic approach ensures you can sufficiently understand and effectively address the problem.
Thorough verification safeguards your embedded systems from hardware-related issues. Verification strategies include ensuring the power supply delivers the correct voltage and current, as an inadequate power supply can lead to erratic system behavior. Proper grounding is also essential to avoid noise and interference that can cause unpredictable behavior.
Additionally, verify that all components function as expected and are correctly rated for the operating conditions. Regular inspection using tools like multimeters and oscilloscopes, along with a visual inspection for correct component placement and soldering, is necessary to identify and prevent potential hardware problems.
Leveraging IDE Features for Enhanced Debugging Experience
Modern integrated development environments (IDEs) like STM32CubeIDE and VSCode with PlatformIO offer integrated features that significantly speed up debugging. These IDEs provide tools for in-depth code analysis, including built-in or third-party static code analysis tools, identifying potential issues and bugs.
Their integration with version control systems is invaluable for tracking changes, helping pinpoint when and how a bug was introduced. This seamless amalgamation of various features within the IDE streamlines the debugging process, enhancing its efficiency and effectiveness.
Conclusion
Throughout this tutorial, you explored real-time tracing, live variable monitoring, advanced breakpoint usage, and other debugging techniques. By taking a carefully coordinated approach to debugging, you can demystify code and gain a deeper understanding of system behavior.
Blues University
This article if part of a broader series where you can dig deeper into each aspect of embedded development. To embark on this journey, be sure to follow Blues University, where you can explore and contribute to shaping the future of IoT.
If you're new to embedded development and the IoT, the best place to get started is with the Blues Starter Kit for Cell + WiFi and then join our community on Discourse. 💙