

I don't know about you, but the code I write is always perfect. It's bug-free. I understand exactly what's happening in every 3rd party library I use and there is never a situation where I need to see what's going on under the covers.
It Just Works™.
Back in reality, it's a minor miracle if I write more than a couple lines of code without some flaw. Maybe it's a simple syntax mistake or maybe the logic I'm coding fundamentally alters the functional intent of my product. Either way, I need a decent debugger to make me even remotely efficient.
As someone who grew up in the web/mobile/cloud world, I'm used to using robust debuggers in tools like Visual Studio alongside Postman and the inspectors available in virtually every web browser today. Unfortunately the embedded space still lags behind when it comes to ease of both iterative development and on-device debugging of code in realtime.
This article aims to provide a little bit of guidance for those of you who, like me, certainly try to write bug-free code, but need a little help. Specifically, we are going to look at getting started debugging code on both the STM32 and ESP32 architectures using Visual Studio Code and PlatformIO.
Let's dig in and squash some bugs on the STM32 and ESP32.
Debugging on STM32
Step 0: You'll need an in-circuit debugger and programmer for the STM32.
Using a debugger/programmer is not just a means to properly debug and inspect code while it's running on a device, it also helps you deploy updated firmware without contorting your fingers to press tiny buttons, forcing the board into its bootloader.
The STLINK line from STMicroelectronics and J-Link from Segger are two popular types of debuggers that work with STM32-based boards.
In this section I'm going to document how to debug with the STLINK-V3MINI, but your experience with other similar programmer/debuggers shouldn't differ.
Connecting an STLINK
Depending on the host board you are using, you can either connect the STLINK via a 14-pin STDC14 header or manually wire it via GPIO pins.
 note
noteIf you're using a Nucleo board or Discovery kit, these come with an on-board STLINK debugger, so using an external STLINK is not necessary!
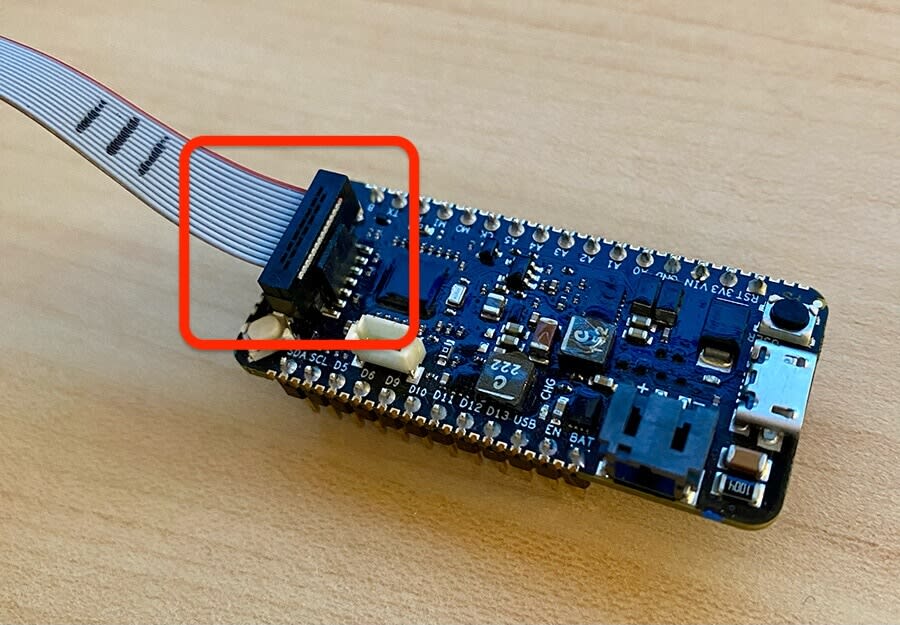
For example, the Blues Swan includes a 14-pin male STDC14 header, so the STLINK-V3MINI slots easily onto the board:
However, if you have to directly wire the GPIO pins from the STLINK, be sure to follow this wiring guide:
| Pin function | Debugger pin | Target pin |
|---|---|---|
| Ground pin | GND | Any GND pin |
| +3.3V pin | VCC / VDD / 3.3V | Any +3.3V pin |
| Clock pin | SWCLK / SWCK | PA14 |
| Data pin | SWDIO | PA13 |
 warning
Do not connect the +3.3V pin if you are powering your board externally.
noteA full set of guides for connecting your STLINK is available here.
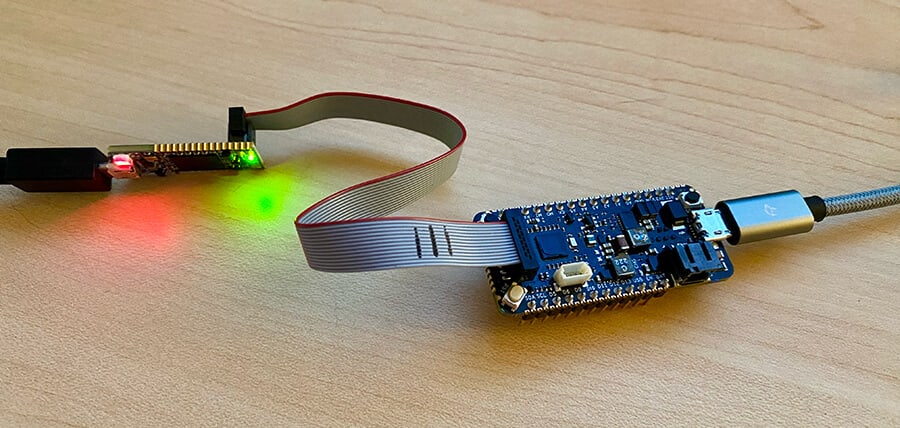
Powering STLINK and Host
The STLINK requires a direct serial connection to your PC, often using a Micro USB or USB-C cable. However, since the STLINK cannot power your host STM32 host directly, you'll also need to provide power to the board. This can be accomplished either via an external LiPo battery or by connecting another USB cable from the host to your PC.
Debugging with STLINK-V3MINI
Let's look more closely at how to set breakpoints and use the "step out", "step over", and "step into" commands to debug firmware running on an STM32 host.
New to PlatformIO? Get started with What is PlatformIO?.
-
Update your
platformio.inifile to add the specific debugging tool you're using.debug_tool = stlink -
While you're at it, update that same file to include the proper
upload_protocol, which dictates how firmware is uploaded to the device:upload_protocol = stlink -
And...that's actually all you have to do to enable debugging in PlatformIO!
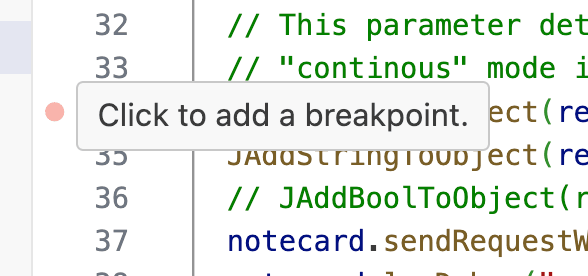
-
Next, you can set one or more breakpoints on any line of code by clicking in the small column to the left of any line number. This will add a little red dot (the breakpoint) which will halt execution of the program and allow you to manually debug and inspect relevant variables and properties.
-
With your breakpoint(s) set, it's time to build and deploy to your STM32 device. Navigate to the "Run and Debug" tab in VS Code and press
F5(or hit the "Start Debugging" button) to build and deploy to your device: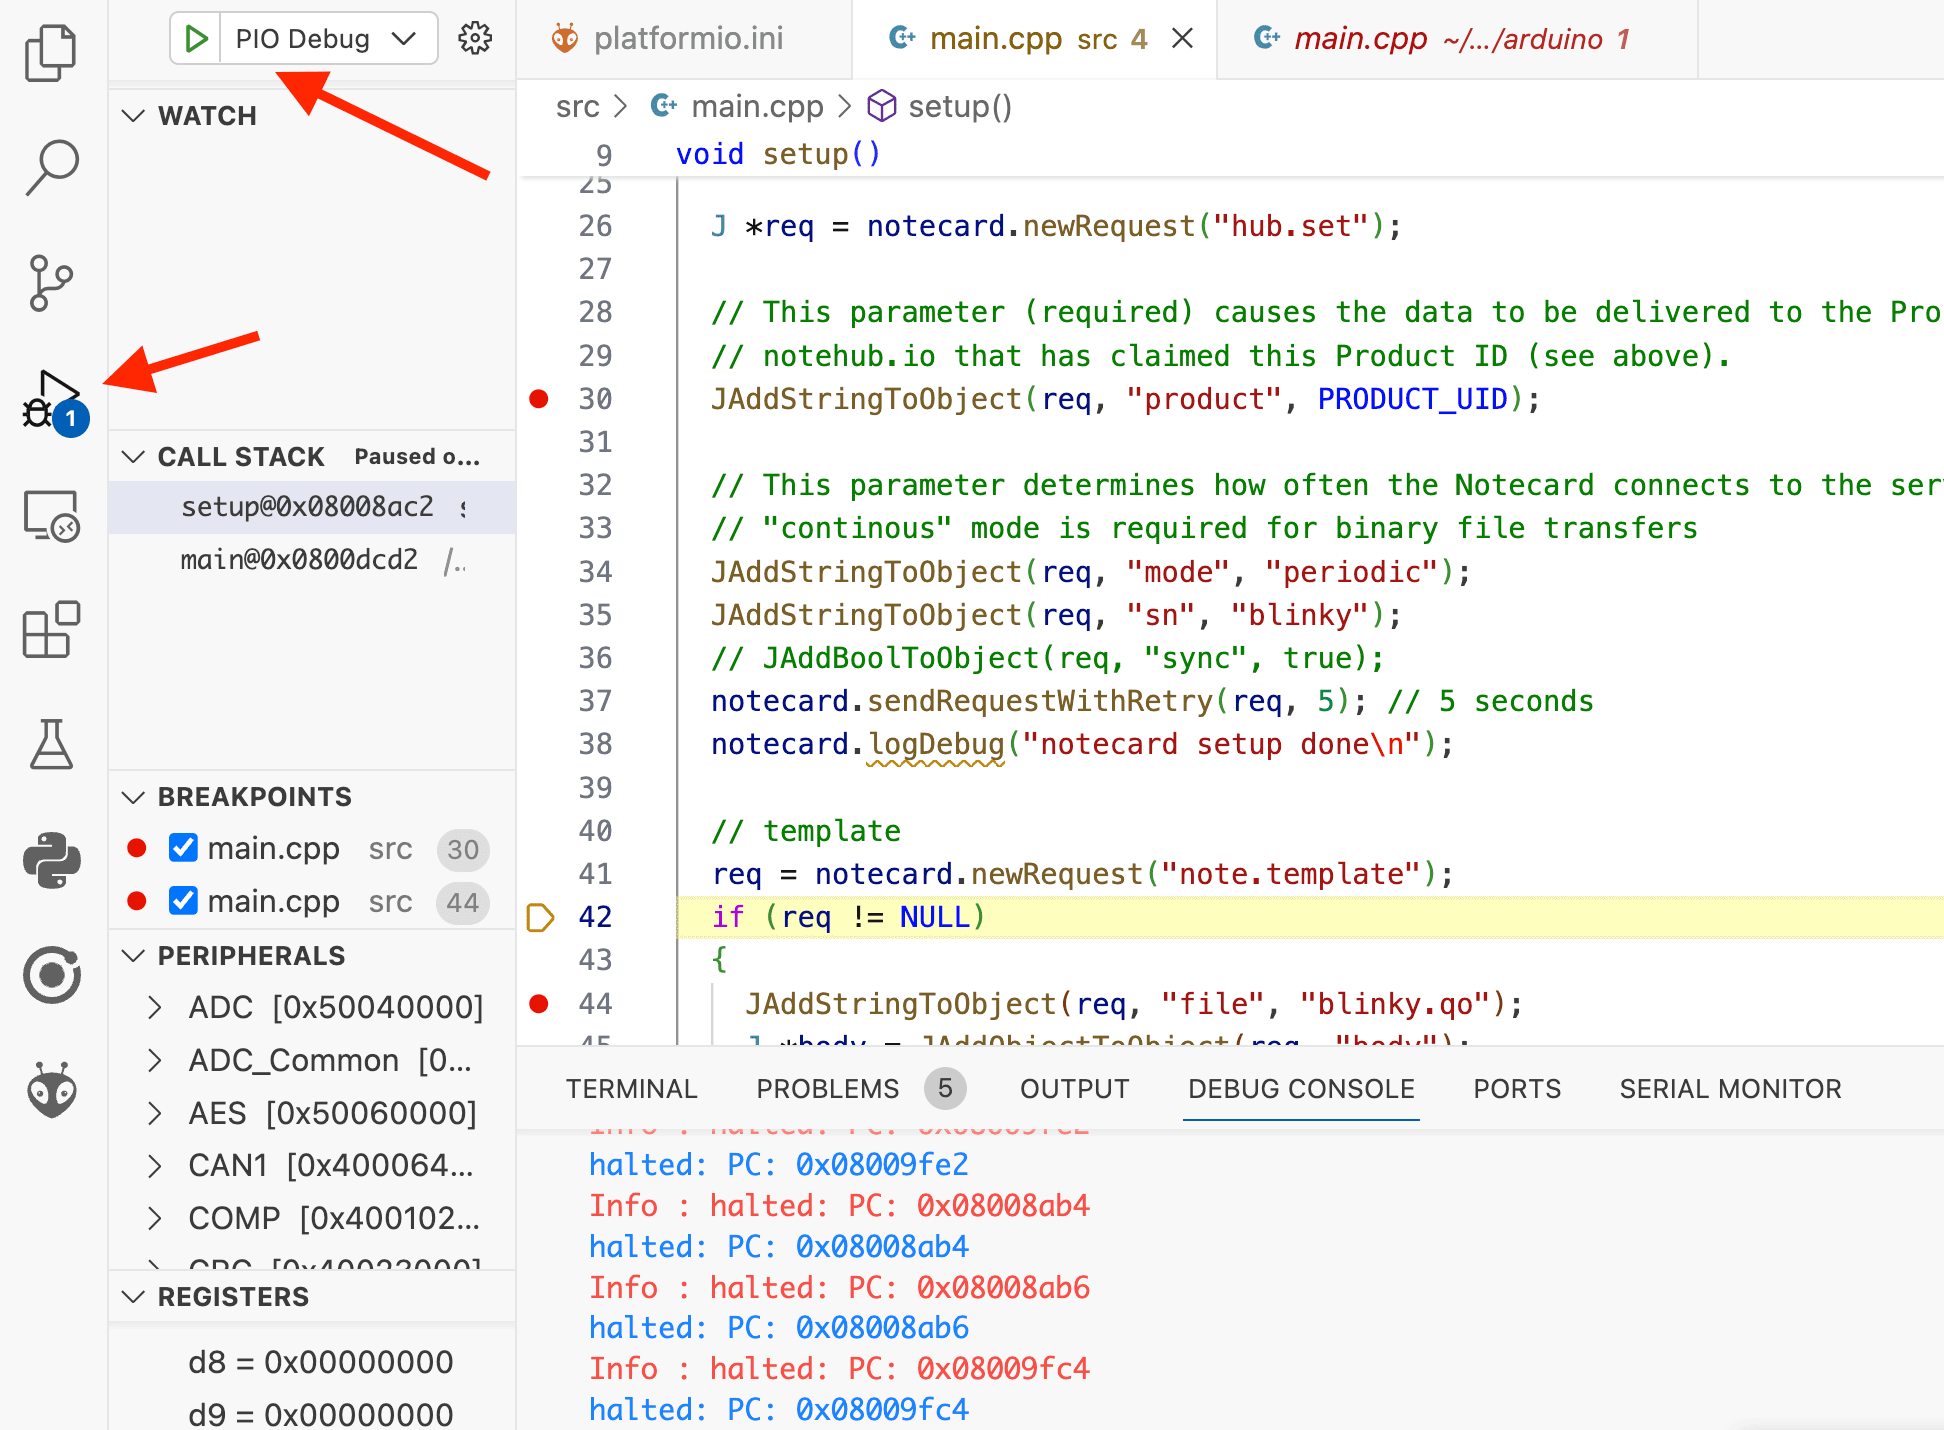
-
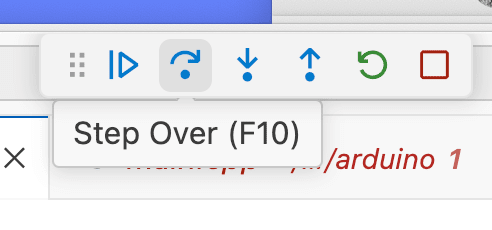
Code will be executed and advance line-by-line until a breakpoint is hit. At that time, you'll be allowed to inspect variables, memory allocations, and either step over, into, or out of the current state.
-
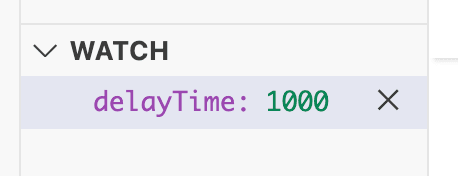
One of the more useful features of debugging in VS Code is adding a variable to "watch". This lets you watch the value of any specified variable when a breakpoint is hit, and follow as it changes.
You can even manually edit the variable value and see how it impacts your device in realtime!
Debugging on ESP32
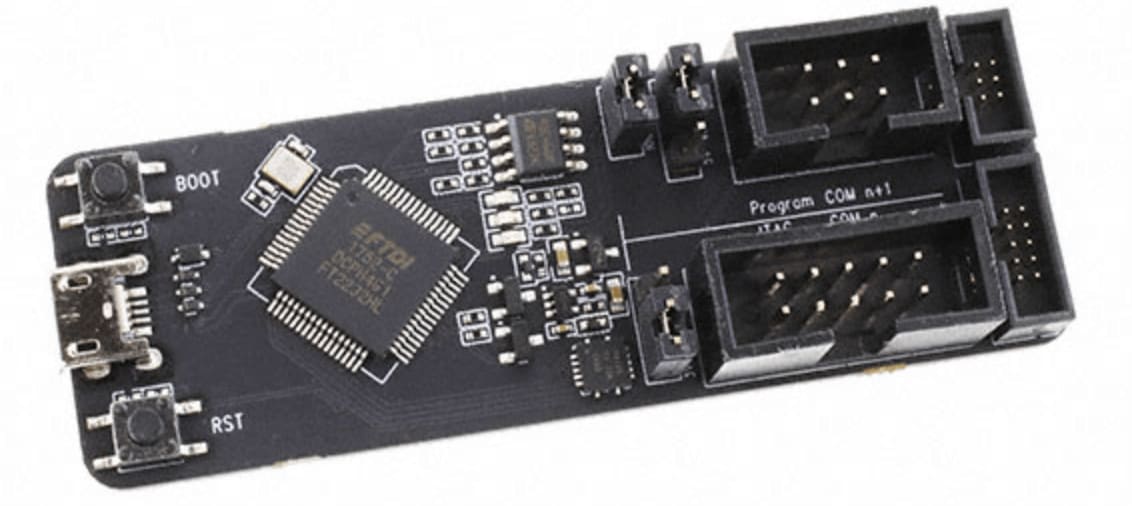
Just like when debugging on an STM32, when working with an ESP32-based board your journey begins with a debugger/programmer. The most commonly used debugger is the ESP-Prog.
You can also use FT2232HL- and FT232H-based debuggers or the aforementioned Segger J-Link. Certain ESP32-based dev boards like the ESP-WROVER-KIT ship with an integrated debugger.
Connecting an ESP-PROG
Most ESP-Prog boards ship with multiple ribbon cables that let you connect directly to your board, provided the appropriate JTAG port is exposed. Unfortunately in ESP32 land, that's not the norm.
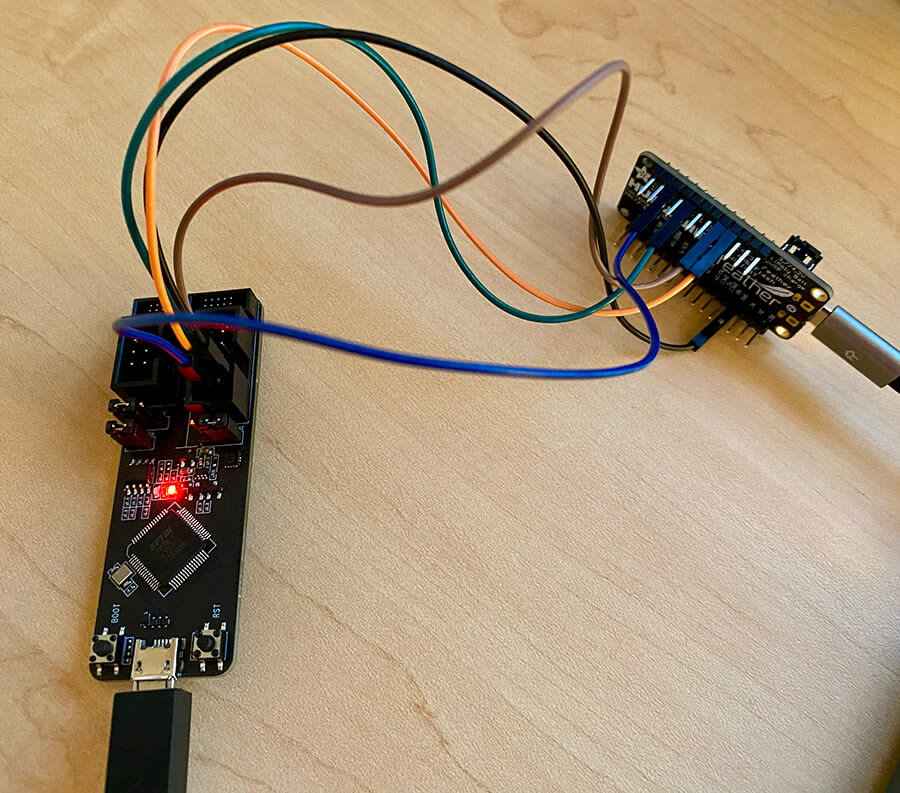
In my case, I'm using Adafruit's HUZZAH32 Feather and therefore have to manually wire my host to the ESP-Prog. No worries though, as the wiring required is relatively minimal:
| JTAG | ESP32 |
|---|---|
| GND | GND |
| TDO | GPIO15 |
| TDI | GPIO12 |
| TCK | GPIO13 |
| TMS | GPIO14 |
For reference, here is the pinout for the ESP-Prog:
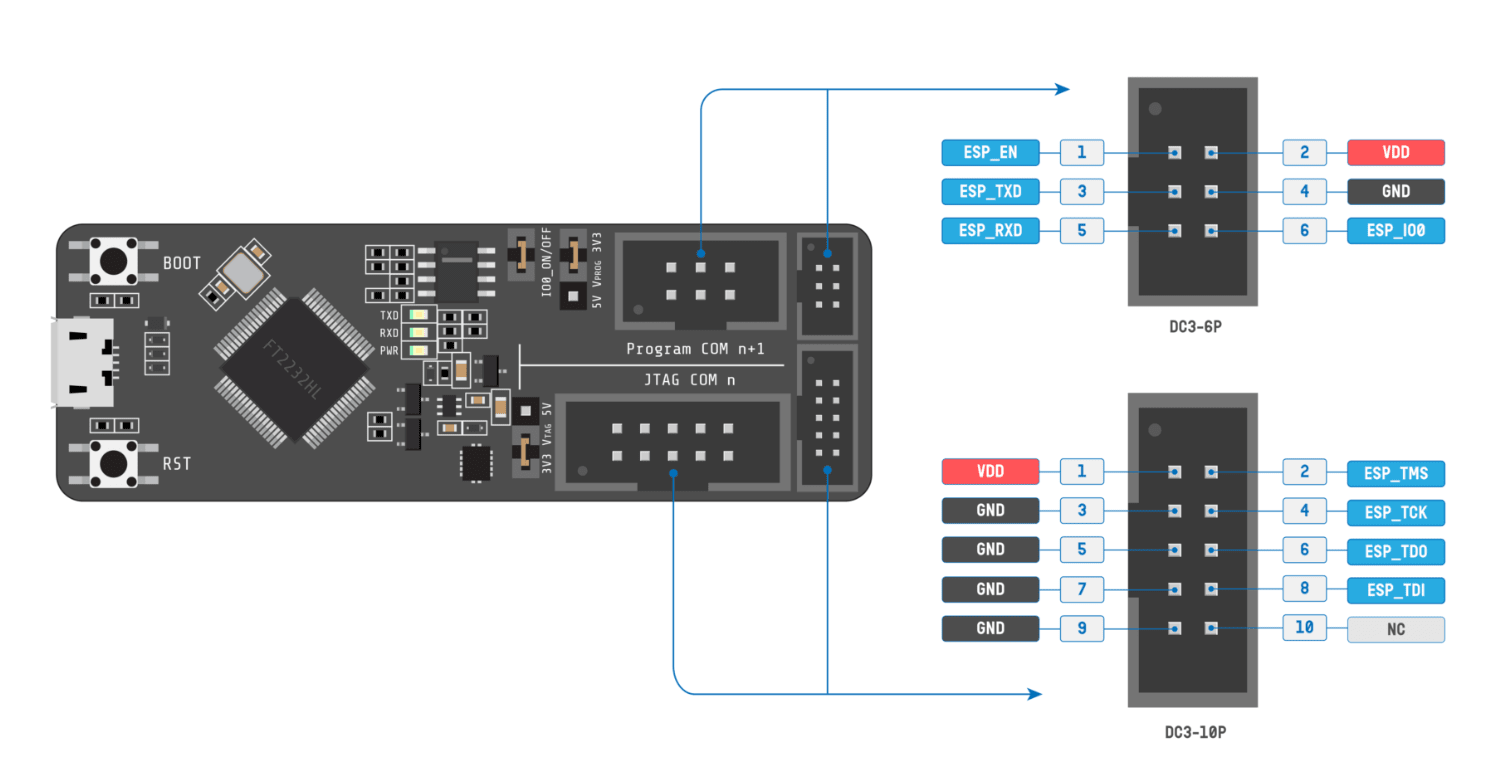
Powering ESP-Prog and Host
When all is said and done, the ESP-Prog is connected via a Micro USB cable, properly wired to my Feather, and the Feather is also connected to my computer via Micro USB (but could also be powered via a LiPo battery).
A bit messy, but it works!
Debugging with ESP-Prog
Like we did above with STM32, let's see what changes we need to make to our PlatformIO project to enable debugging on the ESP32.
-
Add the following lines to your
platformio.inifile to specify the debugging tool you're using. Use oftbreak setupis optional, but useful if you need the debugger to halt anywhere in thesetup()method.debug_tool = esp-prog debug_init_break = tbreak setup -
And that's the only configuration required in PlatformIO!
-
Using Windows? You may also have to install Zadig to add the "WinUSB" driver. See this Hackster tutorial for more information. Don't worry, it's not as bad as it sounds!
-
Next, just like with STM32, you can set one or more breakpoints on any line of code by clicking in the column to the left of a line number.
-
With your breakpoints(s) set, build and deploy to your ESP32 device by navigating to the "Run and Debug" tab in VS Code and pressing
F5(or use the "Start Debugging" button).Again, just like with STM32, your code execution will halt when it reaches a breakpoint, allowing you to watch variables and inspect other properties.

warningSince the ESP32 uses GPIO 13 to manage its onboard LED and ESP-Prog also
uses GPIO 13 for TCK (test clock), you won't be able to use the onboard LED
while debugging.
Hopefully this will save you the hours it took me to figure that out!
Wrapping Up
I'm hoping this article helped you take those first steps to properly debug on STM32 and ESP32 boards with PlatformIO and VS Code. While your mileage may vary when using other ST and Espressif configurations, I had luck with the following hardware pairs:
STM32
ESP32
Happy debugging! 🐛