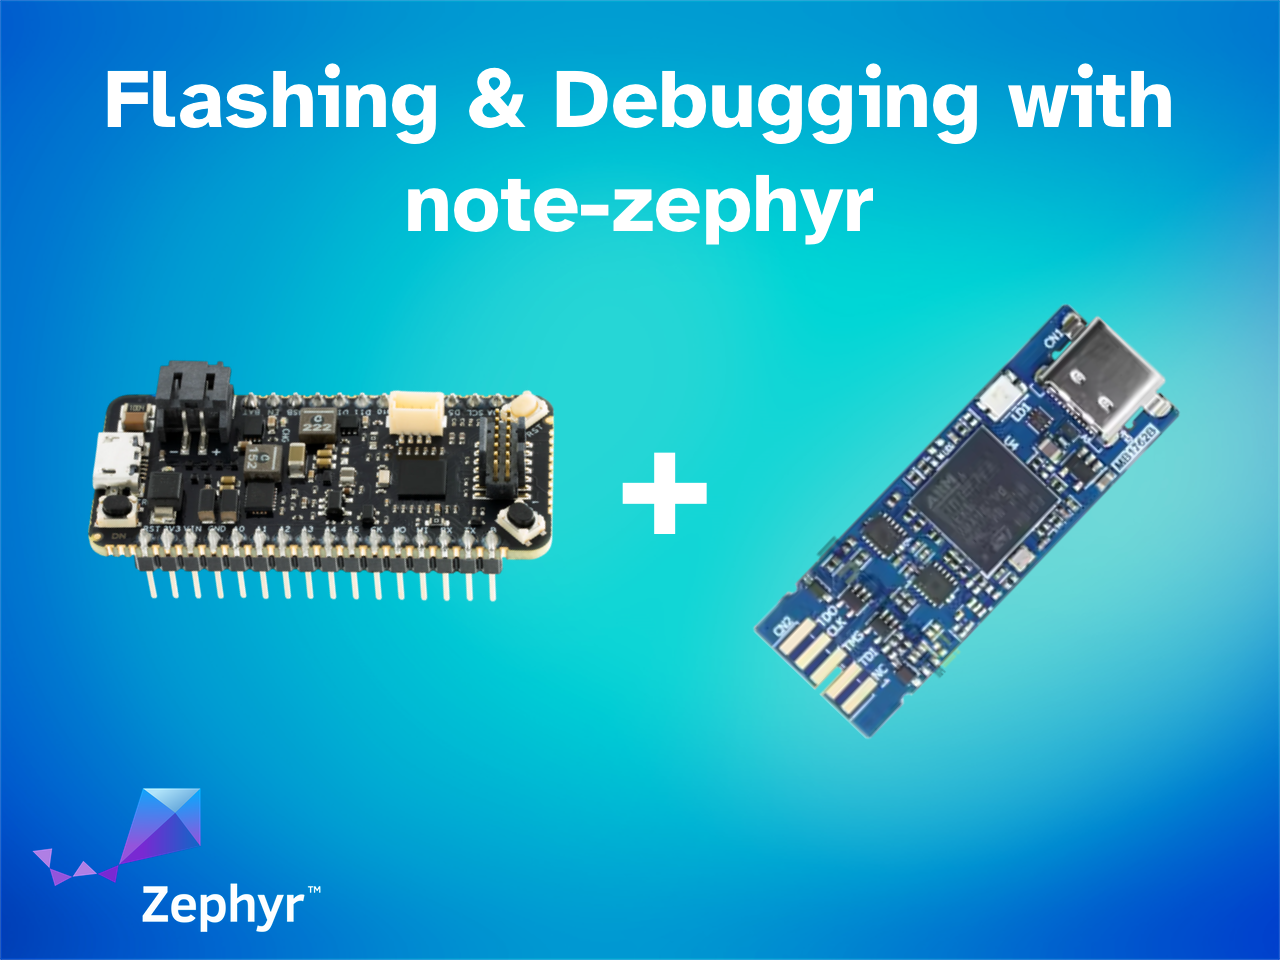
Developing embedded applications can be challenging, especially when it comes to debugging. In this blog post, we'll walk through how to use note-zephyr to make debugging Zephyr RTOS applications for the Notecard and a Feather MCU easier than ever before.
Introduction
IoT solutions are synonymous with embedded development. Anything that needs to be energy efficient and able to run for weeks or even months is often an embedded system. Setting up toolchains, managing dependencies, and configuring embedded debugging tools can be time-consuming and frustrating. We've created the note-zephyr devcontainer to simplify development with Zephyr RTOS and the Notecard.
In this guide, we'll focus on building, flashing and debugging, often the most involved aspects of embedded development. We'll cover how we approach this in note-zephyr with our workflows:
- Native - Bring your environment including Zephyr SDK, west and OpenOCD
- Devcontainer - Use our containerized environment with everything already installed, ready to go
These workflows cover the following use cases, respectively:
- Local - using the debugger tools directly within the devcontainer
- External - connecting from the devcontainer to an OpenOCD server running on your host machine
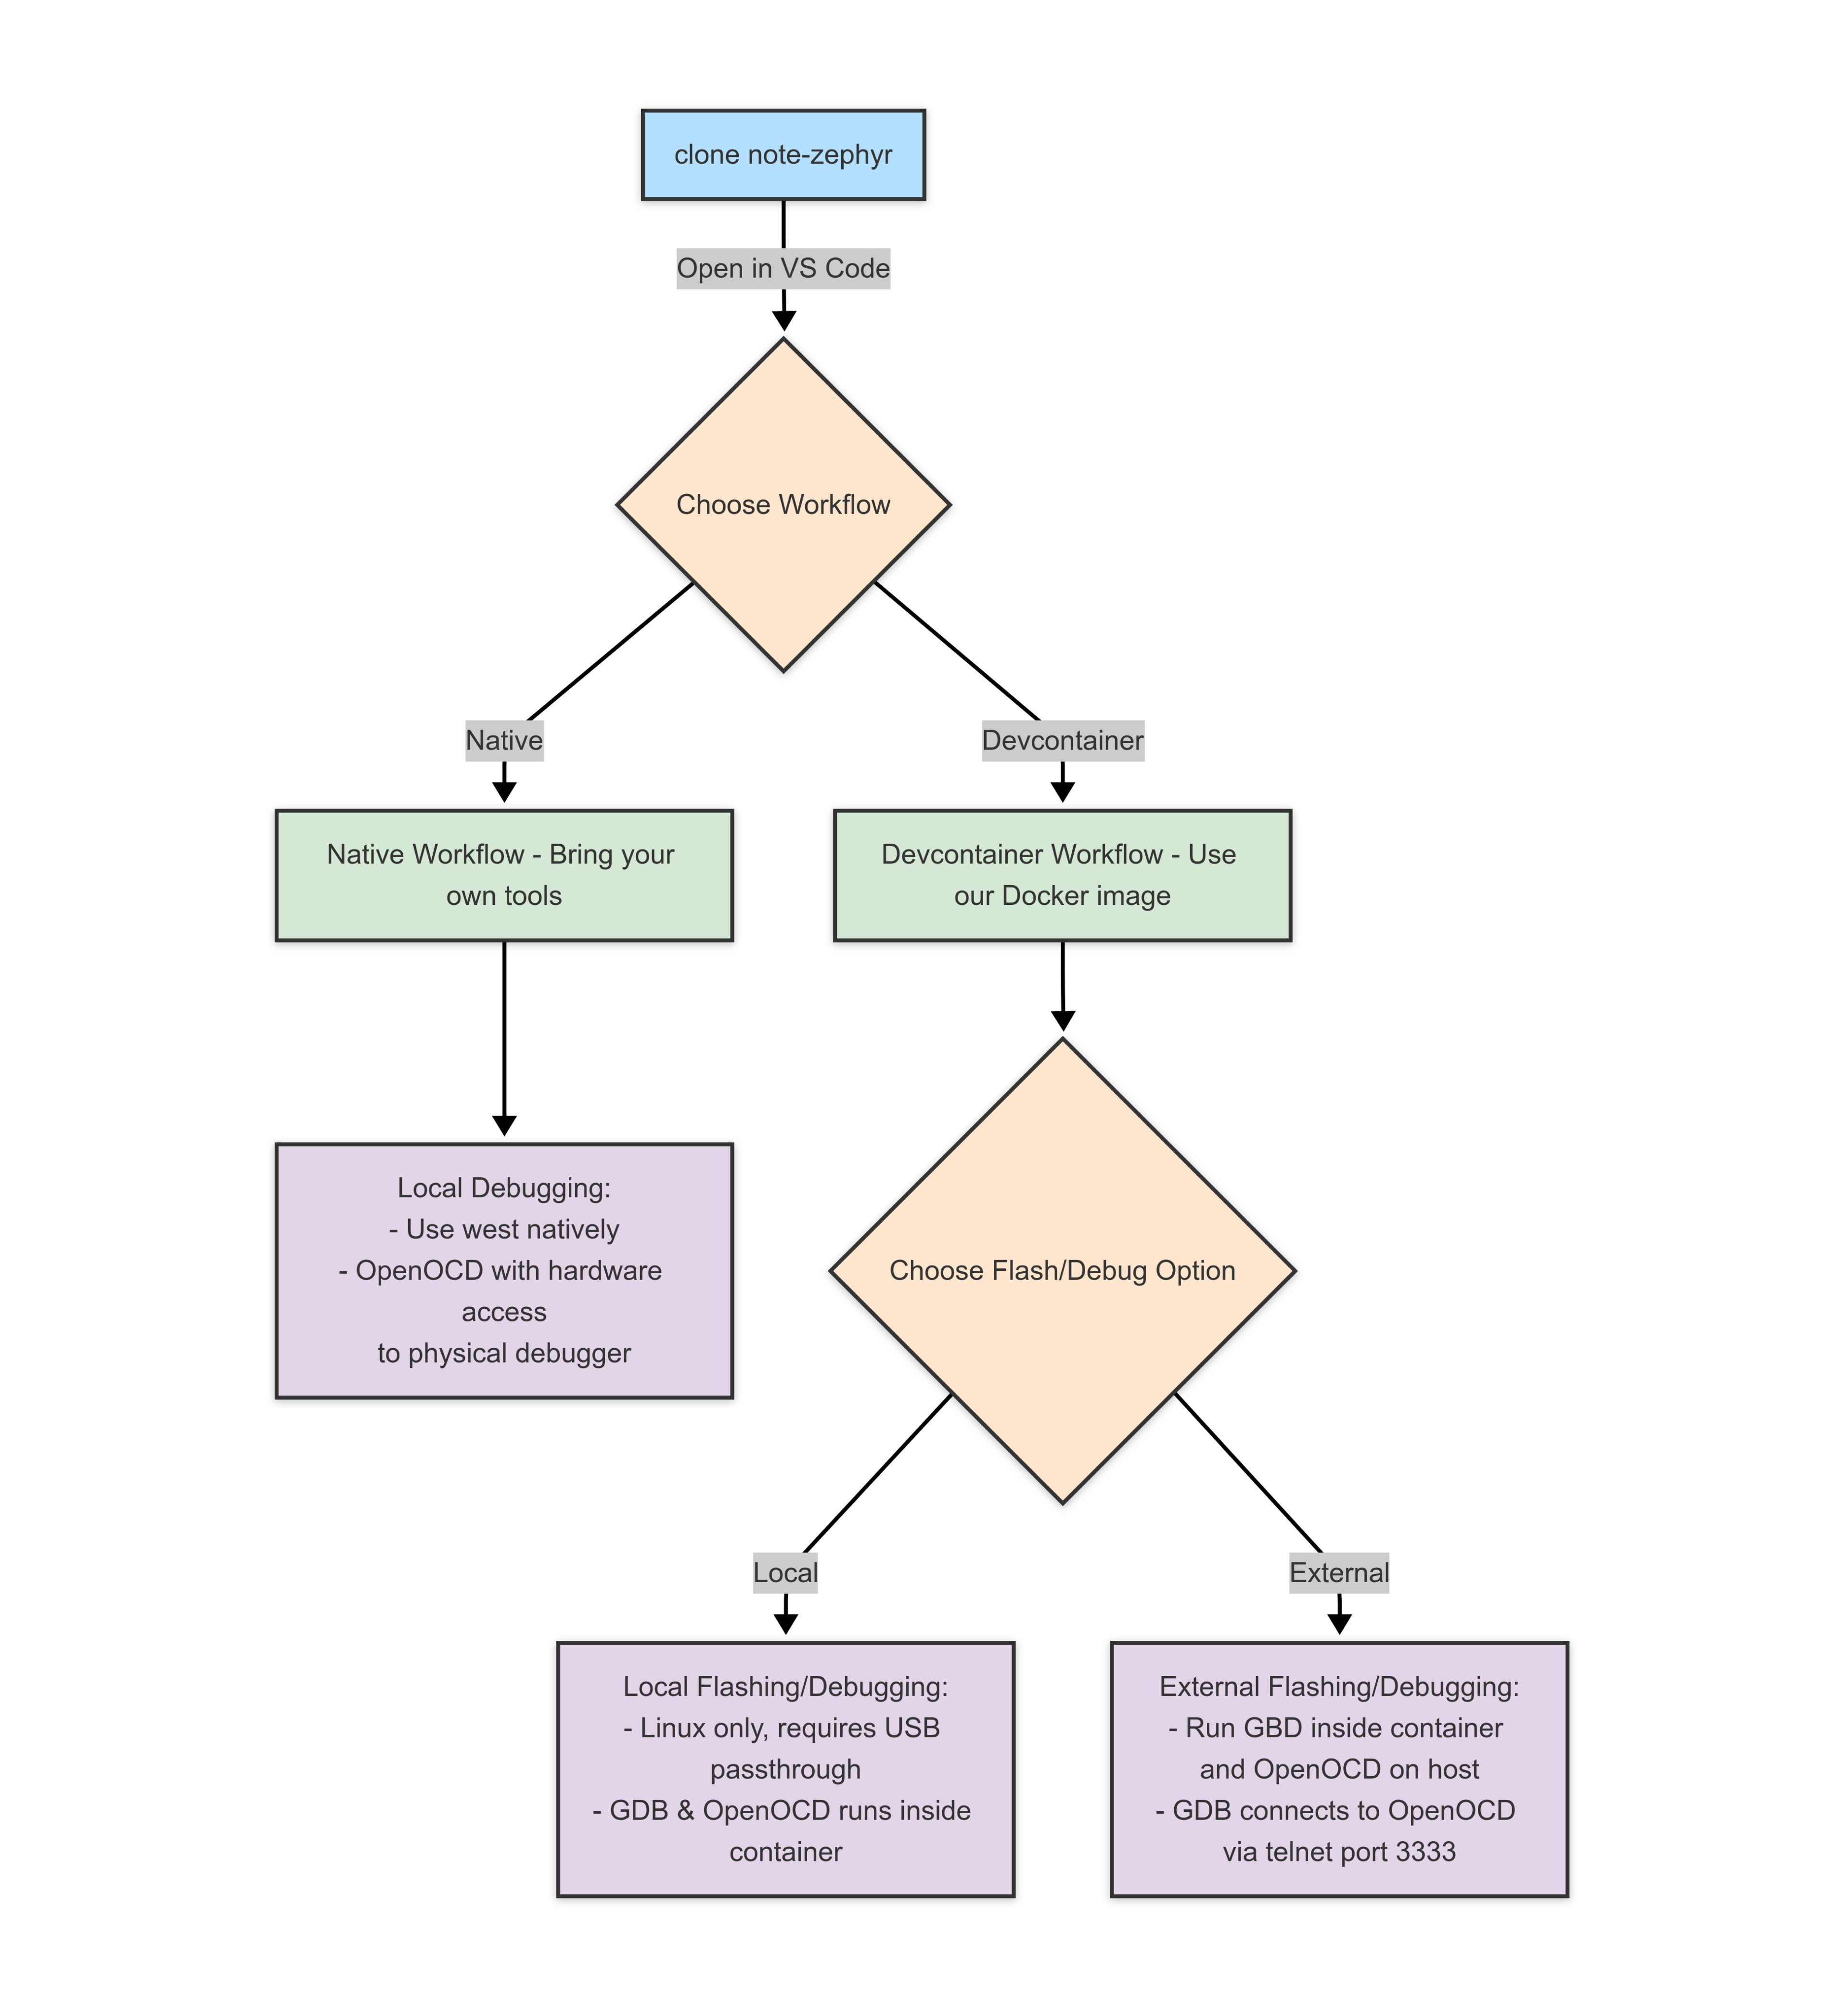
For this tutorial, we're going to focus on the devcontainer workflow as this is most suitable to beginners.
We'll also be using the Swan MCU for this guide but the workflow is the same for the Cygnet; change swan_r5 to cygnet in the VS Code tasks.
By the end of this guide, you'll be able to confidently debug your note-zephyr applications!
Prerequisites
Before we begin, you'll need:
- Swan or Cygnet MCU
- Notecarrier Feather with a Notecard
- STLinkV3
- VS Code
- The Remote - Containers extension for VS Code
- Docker installed and running
- A clone of our note-zephyr repository
Getting Started with note-zephyr
If you haven't used note-zephyr before, you'll first need to clone the repository:
git clone https://github.com/blues/note-zephyr.git
cd note-zephyr
When you open this folder in VS Code, you should see a notification asking if you want to Reopen in Container. Click this button to start the devcontainer. VS Code will build the container image (which may take a few minutes the first time) and then open a new window with everything set up for Zephyr development.
 note
noteIf you missed the notification, you can open the command palette (ctrl+shift+p or command+shift+p) and select Reopen in Container.
The devcontainer includes:
- Zephyr SDK
- West (Zephyr's meta-tool)
- Pre-configured debugging tools, including GDB & OpenOCD
Connecting Your Hardware
Connect your Swan to your computer via USB. The Devcontainer is configured to passthrough USB devices (for Linux). If you're using MacOS or Windows skip ahead to the External sections as they don't support USB passthrough at this time.
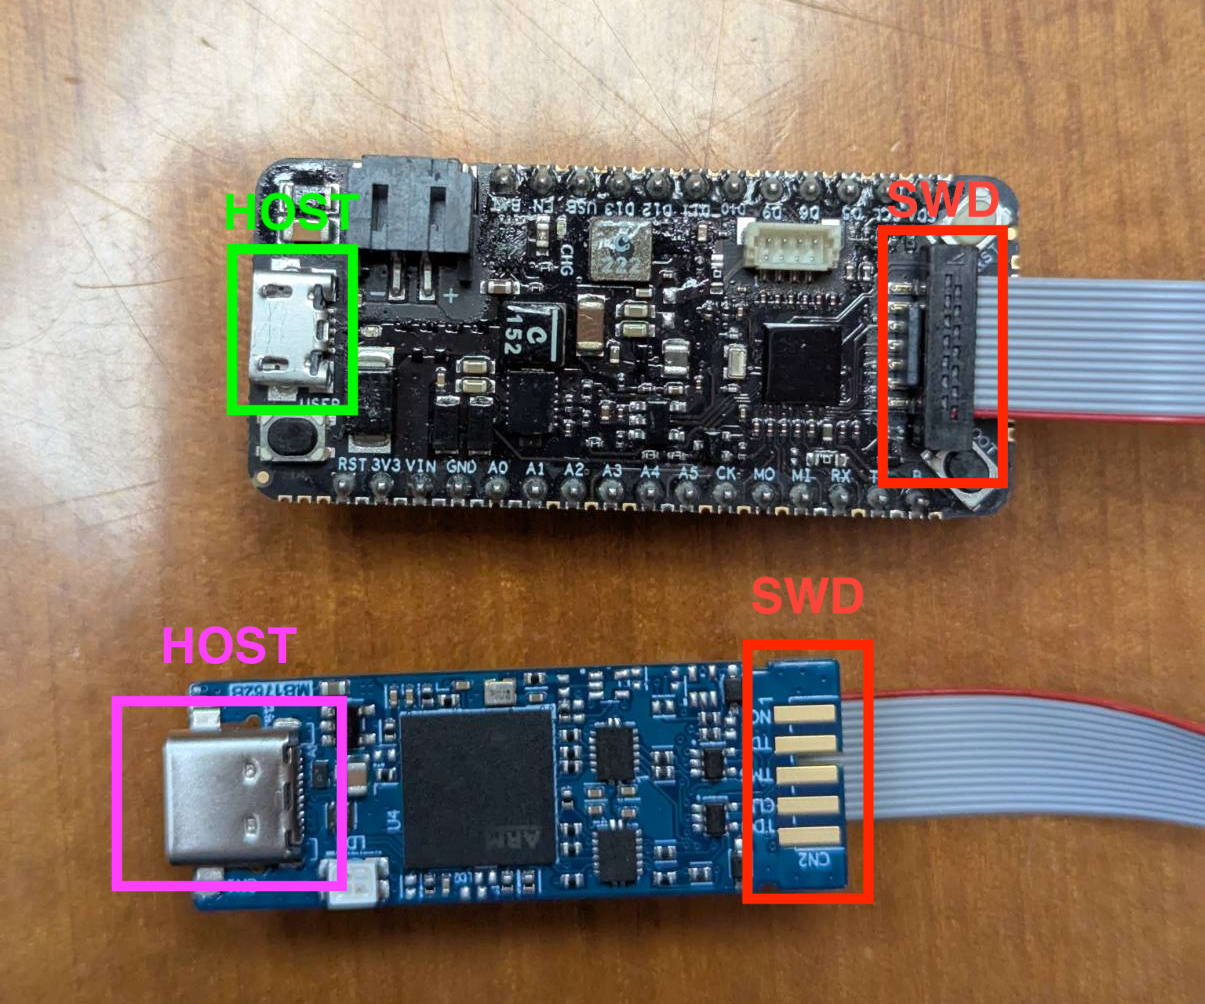
This example shows the Swan MCU attached to an STLinkV3 debugger. Connect the USB ports labelled HOST to your development machine. SWD is the programming interface for the MCU and should connect the Swan to the debugger. Follow the same setup for the Cygnet. While you don't need to connect the Swan's USB to the host, it's useful if you want to use serial over USB.
Understanding the Debugging Tools
Before we dive into debugging setups, let's quickly review the tools we'll be using:
- GDB (GNU Debugger): The core ARM MCU debugging tool that allows us to inspect the running program
- OpenOCD: Open On-Chip Debugger, a free tool that provides a debugging interface for embedded devices
- STLinkV3: ST's hardware debugging probe tool
- VS Code Debugger: The graphical interface for debugging in VS Code
- VS Code Cortex-Debug: The VS Code extension for debugging ARM MCUs
The note-zephyr devcontainer uses these tools together to provide a seamless debugging experience.
Local (Linux only)
This workflow uses the tools directly within the devcontainer. It's the simplest approach if you are running Linux, as USB device passthrough within the devcontainer is supported.
Building and Flashing
To make the experience easier, we've created several VS Code tasks that configure the required options for building and flashing your applications.
You can access these tasks by pressing shift+ctrl+p or shift+command+p to bring up the VS Code command palette. Start typing Tasks and you'll see Tasks: Run Task, from here you'll see a dropdown listing all the available tasks.
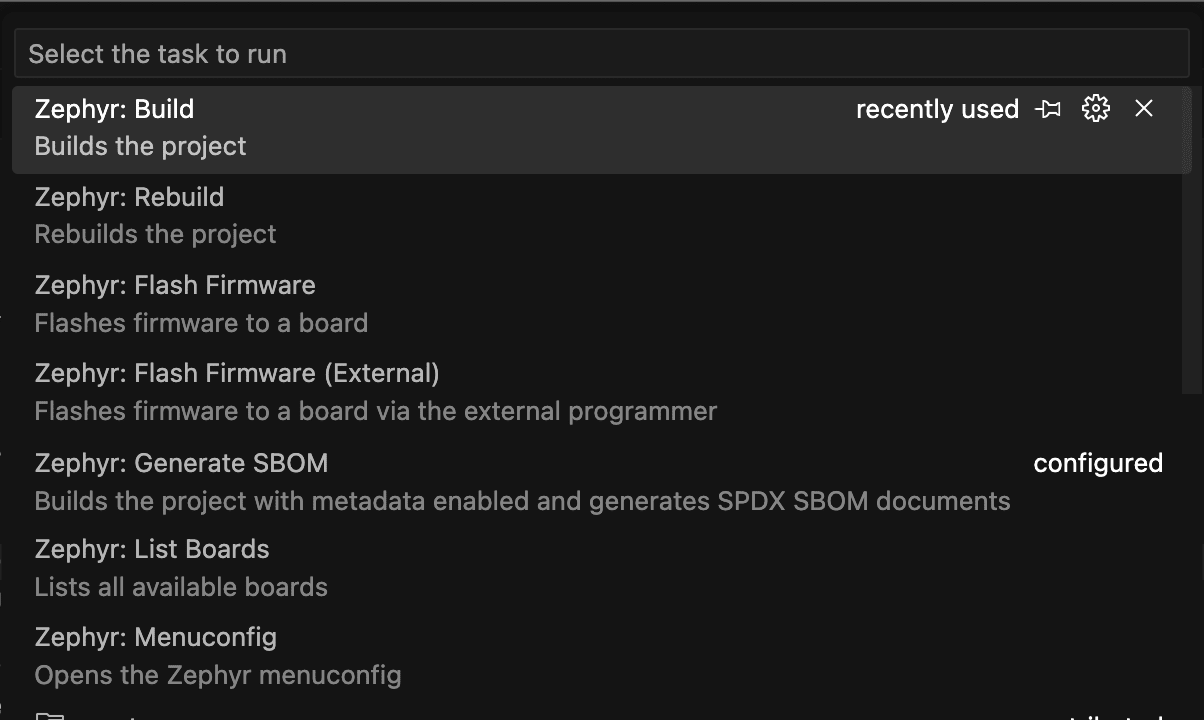
Go ahead and select Zephyr: Build, and you'll be prompted to select a board and specify a project. Choose swan_r5 and then type examples/blinky. Zephyr's west tool will run behind the scenes to build the binary for the blinky example. You should see a build directory appear in the explorer sidebar.
You can then run Zephyr: Flash Firmware and again west will be used to flash the Swan MCU.
 note
noteRemember only Linux supports this workflow from inside the Devcontainer! You can however use these commands with the Native workflow on MacOS and Windows but you'll need to provide your own tooling.
Debugging
Native debugging is simpler to set up and works well for most use cases. In this approach, both OpenOCD and GDB run inside the devcontainer.
Start Debugging
Now you can start debugging:
- Open a source file from your project
- Set breakpoints by clicking to the left of the line numbers
- Click the "Run and Debug" icon in the left sidebar (or press
F5) - Select the "Zephyr Debug (Native)" configuration
- Click the green play button
VS Code will:
- Launch OpenOCD to connect to your board
- Start GDB and load your program
- Stop at your breakpoints, allowing you to inspect variables, step through code, etc.
Debugging Controls
Once you're debugging, you can use the debug controls in VS Code:
- Continue (F5): Resume execution
- Step Over (F10): Execute the current line and stop at the next line
- Step Into (F11): Follow execution into functions
- Step Out (Shift+F11): Continue execution until the current function returns
- Restart (Ctrl+Shift+F5): Restart the debugging session
- Stop (Shift+F5): End the debugging session
You can also view and modify variables in the "Variables" panel, set watch expressions, and view the call stack.
External (OpenOCD on the Host - MacOS/Windows/Linux)
For MacOS and Windows users, or those who prefer to run OpenOCD directly on their host machine, this workflow connects the devcontainer's GDB to an OpenOCD instance running outside the container.
Setting up OpenOCD on the Host
First, you'll need OpenOCD installed on your host machine.
- Linux:
sudo apt install openocd - macOS:
brew install openocd - Windows: Download and install from the official site
You also need the appropriate OpenOCD config file for your board. You can find the swan_r5.cfg file in the note-zephyr GitHub repository, under tools/openocd/swan_r5.cfg.
Open a terminal on your host machine (outside the devcontainer) and start OpenOCD:
# Make sure you have the swan_r5.cfg file accessible
# e.g., copy it from tools/openocd/swan_r5.cfg
openocd -f swan_r5.cfg
This will start OpenOCD and begin listening for GDB connections on port 3333. Keep this terminal window open.
Building and Flashing
Building the application still happens inside the devcontainer using the Zephyr: Build task as described in the Local workflow.
Once built, select the VS Code task Zephyr: Flash Firmware (External). This task uses the OpenOCD instance running on your host to flash the device.
Debugging
Sometimes, you might need to run OpenOCD on your host machine instead of in the container. This is useful when:
- You have specific hardware that requires drivers not available in the container
- You're using Windows or MacOS where USB passthrough isn't straightforward
- You need to use other tools that interface with OpenOCD
Configure External Debugging in VS Code
Ensure your .VS Code/launch.json file includes a configuration for external debugging (this is included in note-zephyr):
{
    "version": "0.2.0",
    "configurations": [
        // ... other configurations if any ...
        {
            "name": "Zephyr Debug (External OpenOCD)",
            "type": "cortex-debug",
            "request": "launch",
            "servertype": "external",
            "cwd": "${workspaceRoot}",
            "executable": "${workspaceRoot}/build/zephyr/zephyr.elf", // Ensure this path is correct for your build output
            "gdbTarget": "host.docker.internal:3333", // Connects to OpenOCD on the host
            "runToEntryPoint": "main", // Optional: run until the main function
            "showDevDebugOutput": "none"
        }
    ]
}
The key settings are "servertype": "external" and "gdbTarget": "host.docker.internal:3333". This tells the VS Code debugger (running inside the container) to connect to the OpenOCD server running on your host machine via port 3333.
Note: On Linux, host.docker.internal might require specific Docker network configuration. However, this is typically set up correctly in our provided devcontainer configuration.
Debug as Before
Now you can start debugging using the Zephyr Debug (External OpenOCD) configuration from the Run and Debug panel. The process is similar to local debugging: set breakpoints, click the play button, and use the debugging controls. The difference is that GDB (inside the container) communicates with OpenOCD (on the host) over the network.
Using the VS Code Debugger
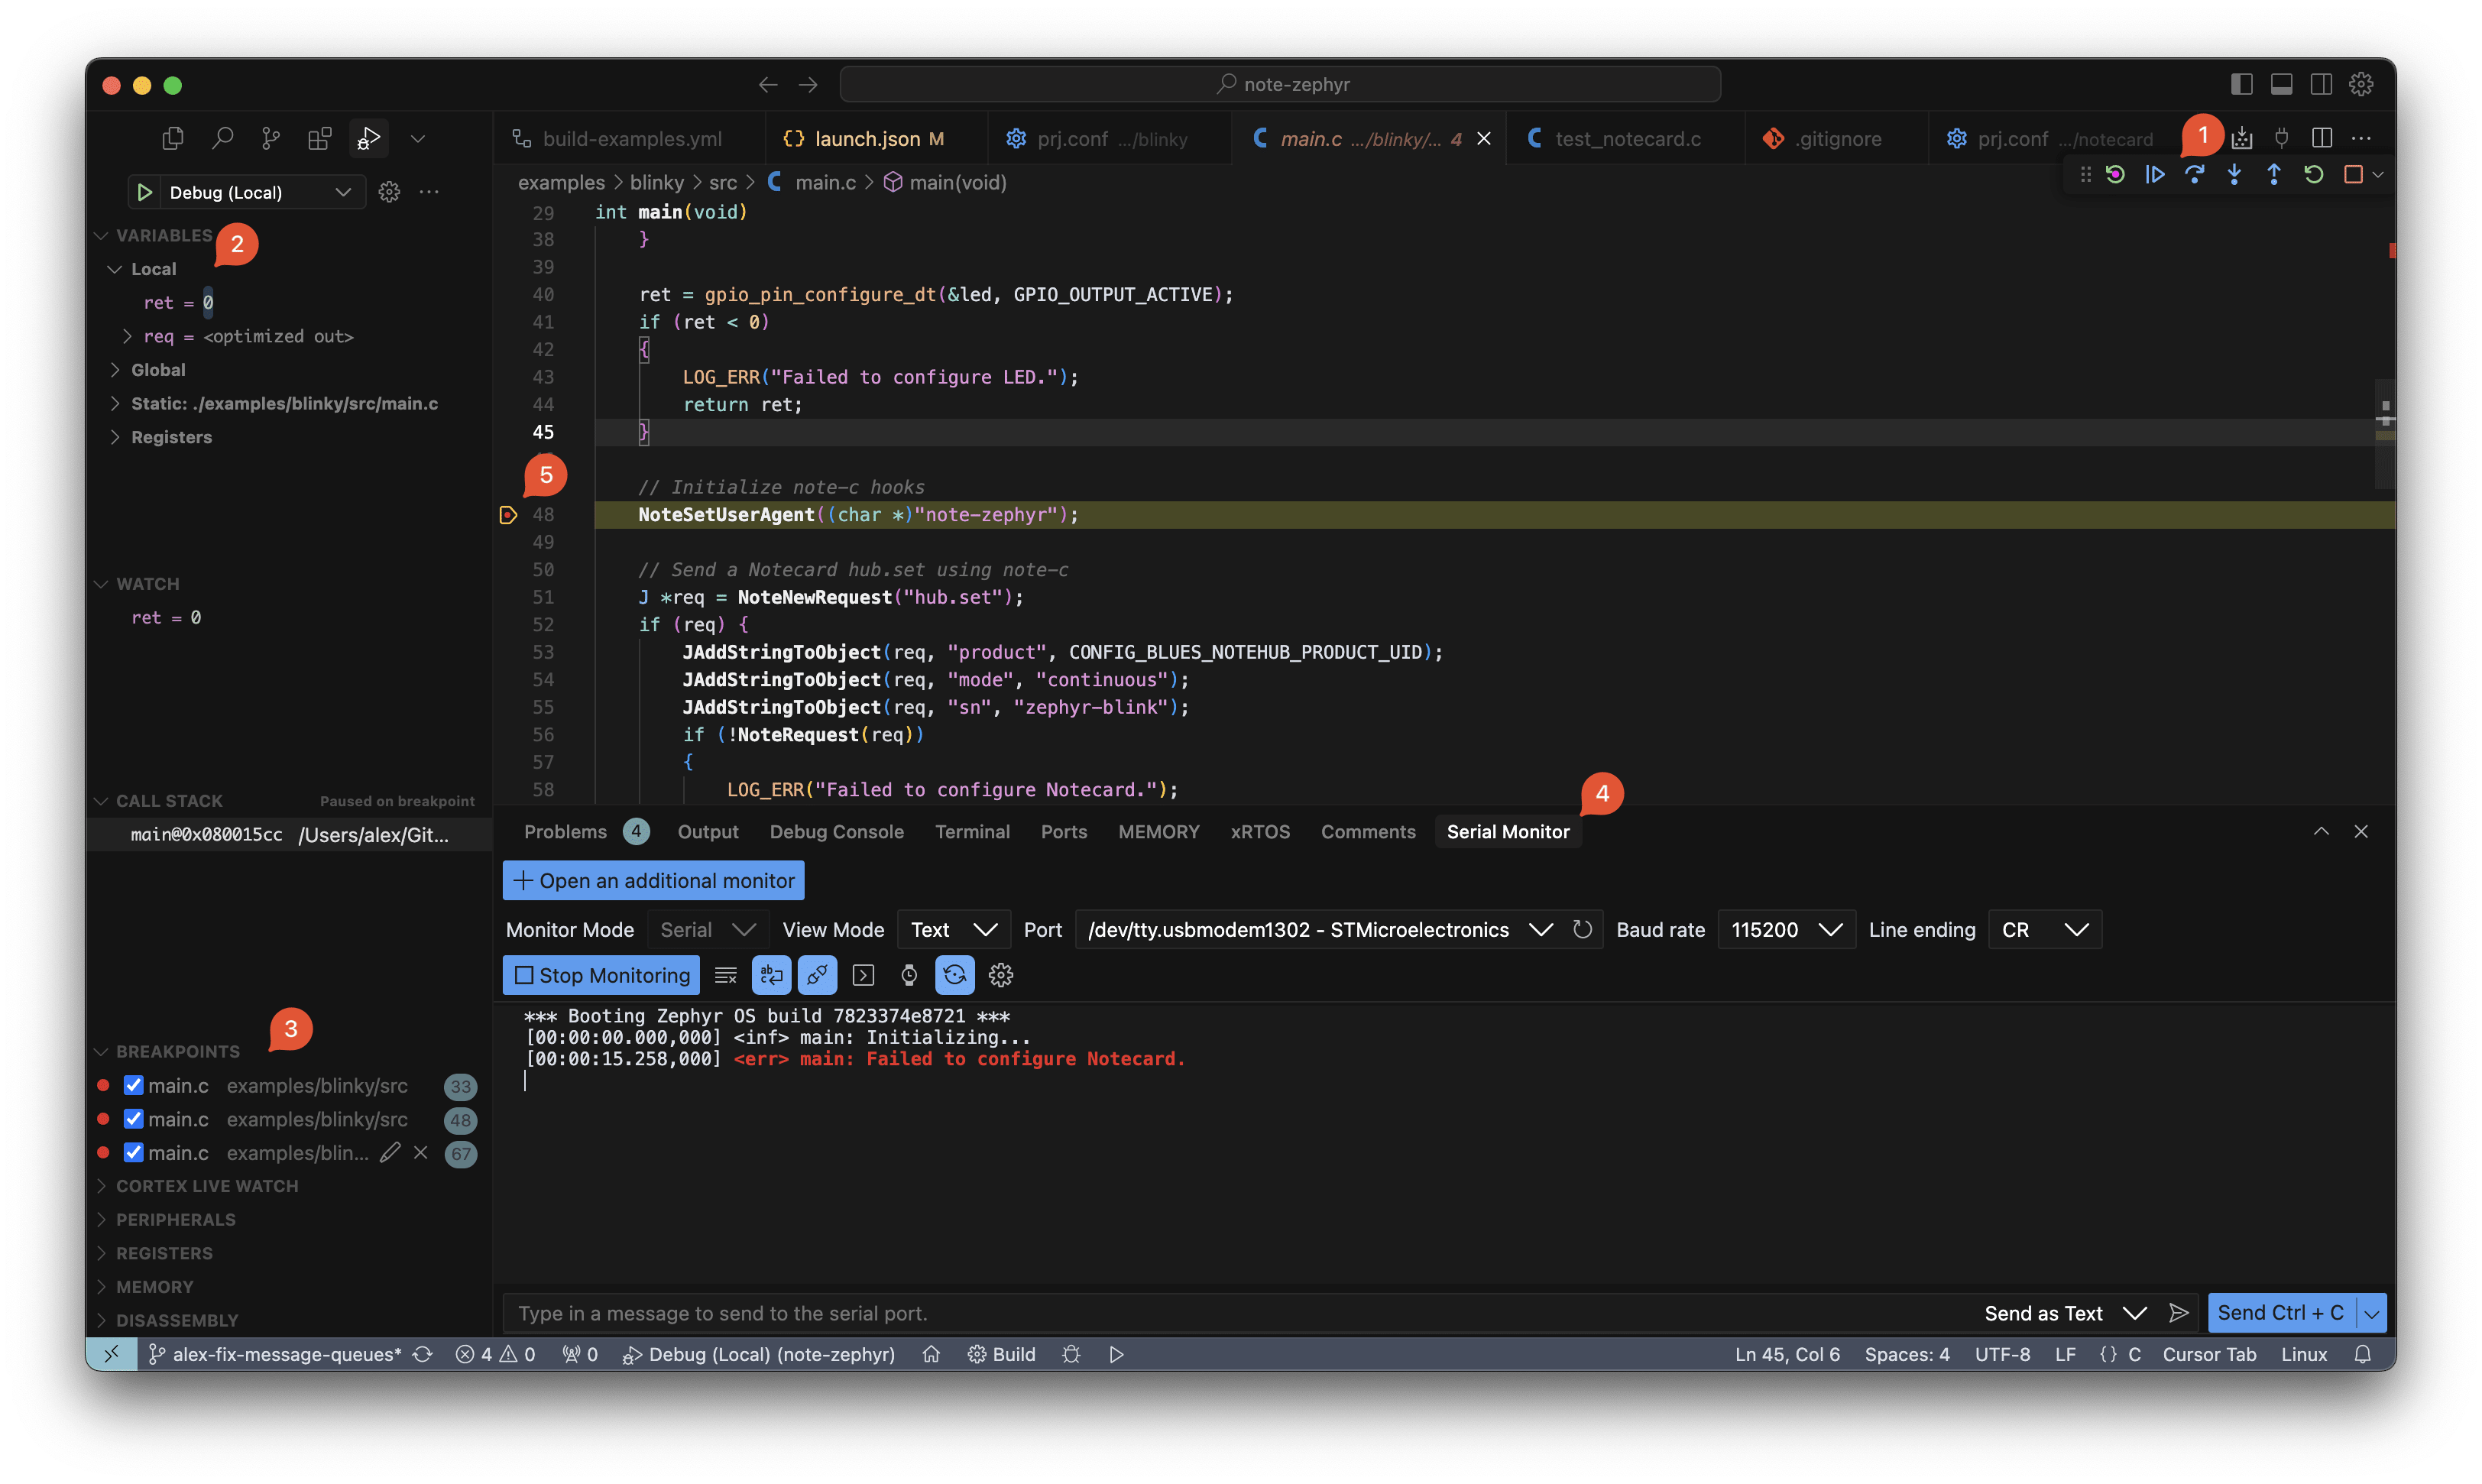
The VS Code debugger is a powerful tool that allows you to debug your application. It's a graphical interface for GDB that allows you to set breakpoints, step through code, inspect variables, and more.
Referencing the image above, the VS Code debugger has two main components, the Run and Debug Controls (1) and the Run and Debug panel (2).
The Run and Debug Controls are the buttons you see when you press F5 to start debugging. These allow you to start debugging, stop, and restart your application. Hovering over the buttons will give you a tooltip with the button's function.
The Run and Debug panel is where you can select the configuration you want to use and start debugging. This is where you'll select the Zephyr Debug (External OpenOCD) configuration. You can also see the breakpoints (3) you've set in the file you're debugging along with any variables you've set to watch.
You may find it useful to use the included Serial Monitor (4) to view the debug output from your application. This is useful if you're not using a RTT console.
Any breakpoints you set will appear in the Breakpoints section, left of the line numbers in the file you're debugging (5).
Common Debugging Problems and Solutions
Below are some common problems you may encounter while setting up and debugging your application and their solutions. If you're experiencing issues that aren't listed here, please reach out to us on the forums and we'll be happy to help!
Error: couldn't find USB device
This typically means OpenOCD can't access your hardware.
Solutions:
- Check USB connections
- Ensure you have the correct permissions (on Linux, you might need to add udev rules)
- Try unplugging and reconnecting the device
- If using external debugging, make sure the device is accessible on the host
Error: unable to connect to OpenOCD
Solutions:
- Verify OpenOCD is running (particularly if you're using the external debugger workflow)
- Check that you're using the correct port (typically 3333)
- For external debugging, ensure
host.docker.internalis resolving correctly - Check firewall settings that might block the connection
Error: target not halted
Solutions:
- Try resetting the board manually
- Use the "Reset and Halt" button in the debug controls
- Try a different configuration file that might better match your hardware
- Our provided
swan_r5.cfgis configured for the STLinkV3, if you're using a different probe you may need to create your own configuration file.
Breakpoints not hitting
Solutions:
- Ensure you're building with debug symbols. Standard
west buildcommands will include debug symbols, so if you're using the VS Code tasks these are already included. - Check if compiler optimizations are disabling your breakpoints
- Verify the source file matches the compiled version
- If you switch between local and external workflows, you will likely need to rebuild the application.
Advanced Debugging Techniques
Once you're comfortable with basic debugging, try these advanced techniques:
Using Conditional Breakpoints
In VS Code, you can right-click on a breakpoint and select "Edit Breakpoint" to add a condition. The breakpoint will only trigger when the condition is true, which is useful for debugging specific cases.
Hardware Watchpoints
For debugging issues like memory corruption, you can use hardware watchpoints that trigger when a memory address is accessed or modified:
watch *(uint32_t*)0x20001000Type this in the GDB console in VS Code to watch a specific memory address.
Examining Memory
Use the GDB console to examine memory:
x/10xw 0x20001000 // Examine 10 words, in hex, starting at address 0x20001000Using Printf() Debugging
Sometimes, the simplest approach is best. Zephyr provides printk() for debug output:
#include <zephyr/kernel.h>

void main(void) {
    printk("Debug: Starting application\n");
    // ...
}
This output will appear in your serial output, depending on your device tree (DT) configuration.
Alternatively, you can use the CONFIG_LOGGING library to output debug messages to the console:
Enable it in your prj.conf:
CONFIG_LOG=y
CONFIG_LOG_DEFAULT_LEVEL=4 // Set to the log level you want to use
Then use the following macro to log messages:
LOG_INF("Debug: Starting application");This will also output to the RTT console or serial output, depending on your DT configuration.
Debugging Real-World Scenarios with the Notecard
Let's look at some specific scenarios you might encounter when working with the Notecard:
Communication Issues
If your application isn't communicating properly with the Notecard:
- Set breakpoints in your I2C or serial communication functions
- Inspect the data being sent to and received from the Notecard
- Verify correct initialization of communication interfaces
- Check for timeout handling in your code
 note
noteThese could be used in conjunction with a Salae Logic Protocol Analyzer to inspect the data being sent and received. We have an I2C Serial Protocol extension for the Logic Protocol Analyzer that can be used translate Notecard I2C traffic directly into human readable serial data.
Power Management
The Notecard is designed for low power applications. If you're experiencing power issues:
- Use breakpoints to track when your device enters or exits sleep modes
- Monitor power management function calls
- Check configuration of sleep states
 note
noteThese could be used in conjunction with a Joulescope to monitor power consumption and to observe power optimizations.
Conclusion
Debugging is an essential skill for embedded development, and with the tools provided in our note-zephyr devcontainer, you can efficiently troubleshoot issues in your Zephyr applications for the Notecard.
We've covered setting up both devcontainer local and external debugging workflows, common problems and their solutions, and advanced techniques to help you develop with confidence.
By using VS Code's debugging capabilities together with our pre-configured devcontainer, you can focus on building your solution rather than wrestling with toolchains and configurations.

