

Hey there! The Notehub team has been busy over the last few months, and today I want to walk you through a handful of the new features and improvements we’ve shipped. All of these are live in Notehub today, so feel free to try them on your own projects as we go.
Let’s dig in.
Smart Fleet Enhancements
Let’s start with smart fleets, a Notehub feature that lets you dynamically categorize devices based on event data. We introduced smart fleets last year, and we’ve recently made two improvements to how they work.
The improvements are easy to see with a quick screenshot:

Improvement #1: Filtering by Notefile
You can now filter smart fleet rules using a dedicated Notefiles filter, instead of having to include logic to filter by Notefile in your JSONata expression.
Most smart fleet rules need to operate on a specific, small list of Notefiles, and this new filter gives you a quick way to select them.
Improvement #2: Apply Smart Fleet Rules at Any Time
Previously, rules only evaluated when Notehub received new events from the fleet’s devices. This made it hard to test fleet membership while creating a rule, because you had to wait for your devices to send data before the rule could apply to them.
To fix that, you now have the option to apply smart rules immediately when creating a new fleet (as shown in the screenshot above), or to apply rules on an existing fleet at any time with the new Apply Now button (shown below).

Resizable Columns
This is a quick one, but it’s a feature I’m already using a lot: most tables in the Notehub user interface now have resizable columns. To try them out, grab the divider between any two column headers and drag them to resize.
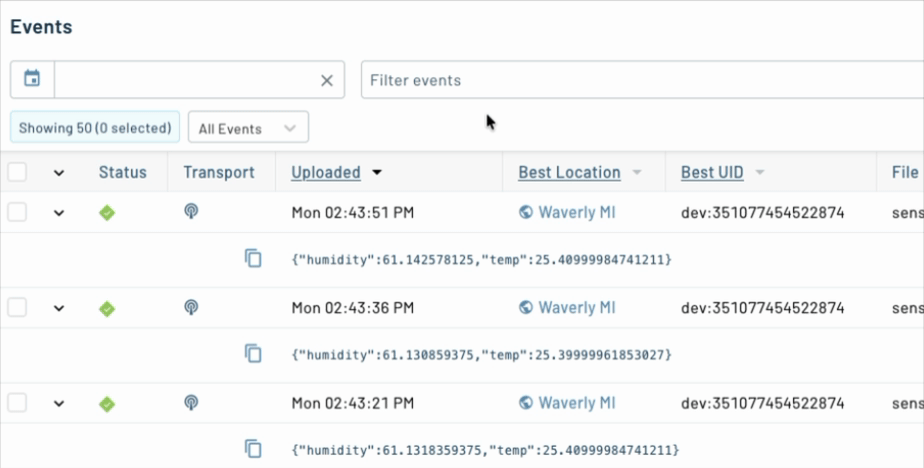
The widths you pick are saved to your browser, so the next time you visit—whether it’s your Devices, Events, Fleets, or Sessions page—your layout is right where you left it.
You can also double click a divider to set a column back to its default width.
UI/UX Improvements for Device Journeys
When a Notecard is configured as an asset tracker it generates a rich set of data about its location, distance, bearing, velocity, and more in the _track.qo Notefile.
In recent Notehub releases we’ve improved how we display this data on a device’s Map tab.
-
There’s a new Journey toggle on the map itself. It’s unchecked by default, so you’ll need to enable journeys to see the visualizations.
-
Once enabled, you’ll see your device’s journeys appear on the map with path lines that are now easier to read at any zoom level.
-
You can now pick a specific journey from a dropdown (or Show All), so it’s much easier to focus on a single trip when a device has been on the move.
For example, here’s the Map view showing two journeys I took yesterday, to and from a soccer practice.

If you haven’t played with device journeys before, now’s a great time to try it.
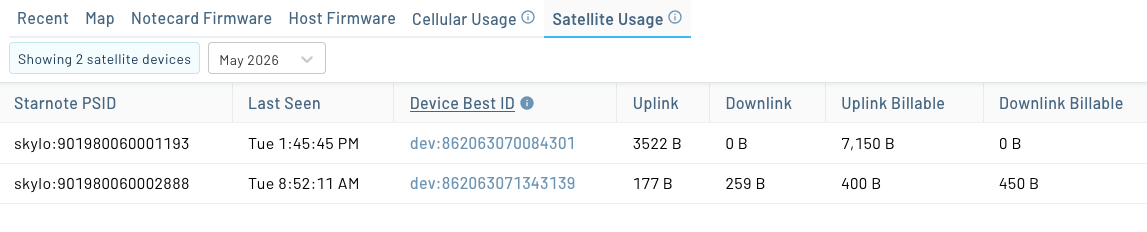
Improved Satellite Usage UI
With the recent launch of Notecard for Skylo and our growing lineup of satellite-capable hardware, satellite connectivity has become a first-class part of the Blues ecosystem. To match that, we've made some significant improvements to how Notehub surfaces satellite usage data.
First, there’s a brand-new Satellite Usage tab on the Devices page. The tab lists every Starnote on your project along with the device that last used it, when it was last seen, and uplink and downlink byte counts (both raw and billable) for the selected billing period.
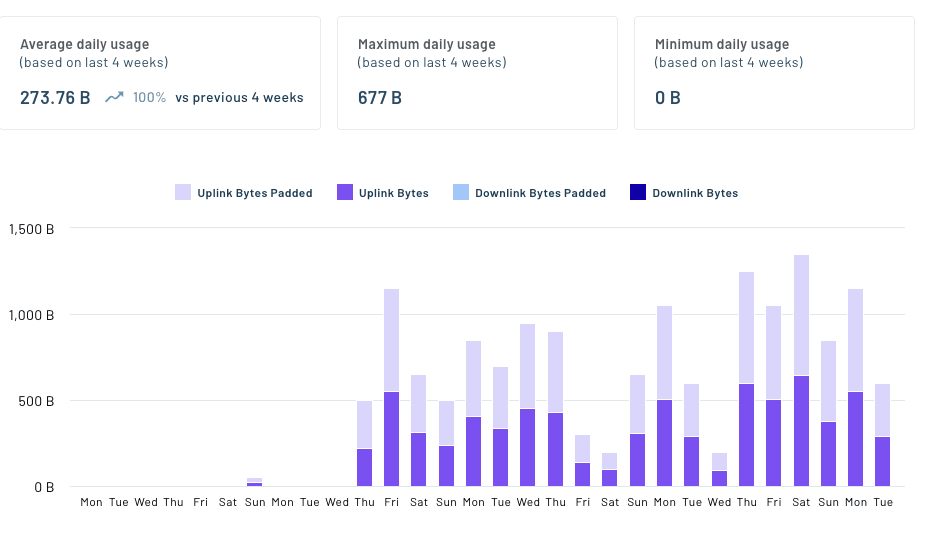
Second, each device’s Usage page includes new charts and data specific to satellite usage. The first set of charts lets you view lifetime usage, average/max/min daily usage, and the daily number of uplink and downlink bytes used.
And the second set of charts lets you view packet utilization.
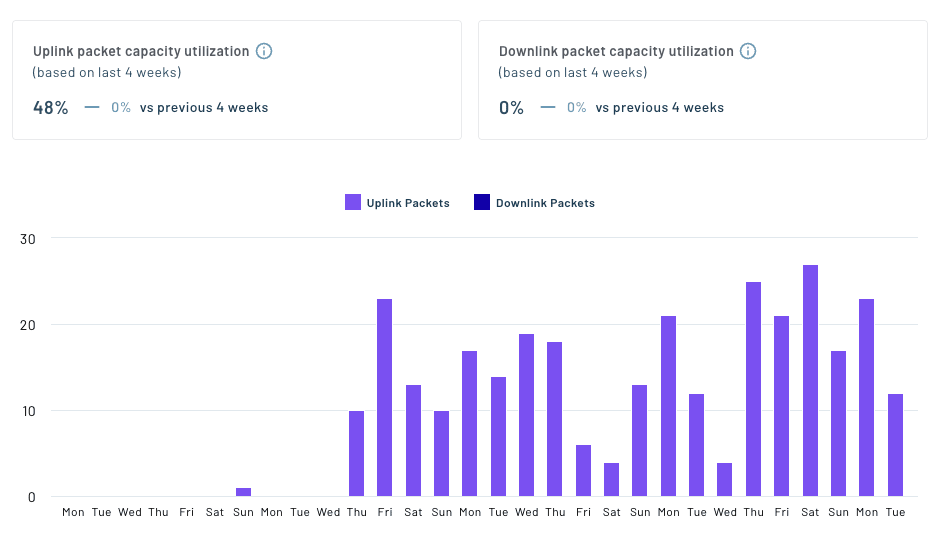
All satellite providers enforce a minimum billable packet size, and packet capacity utilization shows how effectively your device is using that minimum.
For example, packets sent over Skylo’s network have a minimum billable size of 50 bytes. If your device sends data to Notehub in 25-byte packets, your packet capacity utilization is 50%.
All together, these new views make it much easier to understand satellite usage at the device level, and to spot anomalies before they become billing surprises.
Routing Improvements
Next, we’ve made a handful of routing updates aimed at teams with production security and reliability requirements.
Managing Secrets
First, we’ve added a new Secrets interface to Notehub projects to help you manage sensitive values used in routes.
Project secrets are project-scoped key/value pairs used to inject credentials into routes at runtime without storing them in plaintext. They’re encrypted at rest in Notehub, decrypted in-memory only at the moment an outbound route fires, and are never returned by the Notehub API or shown in the UI after they are saved.
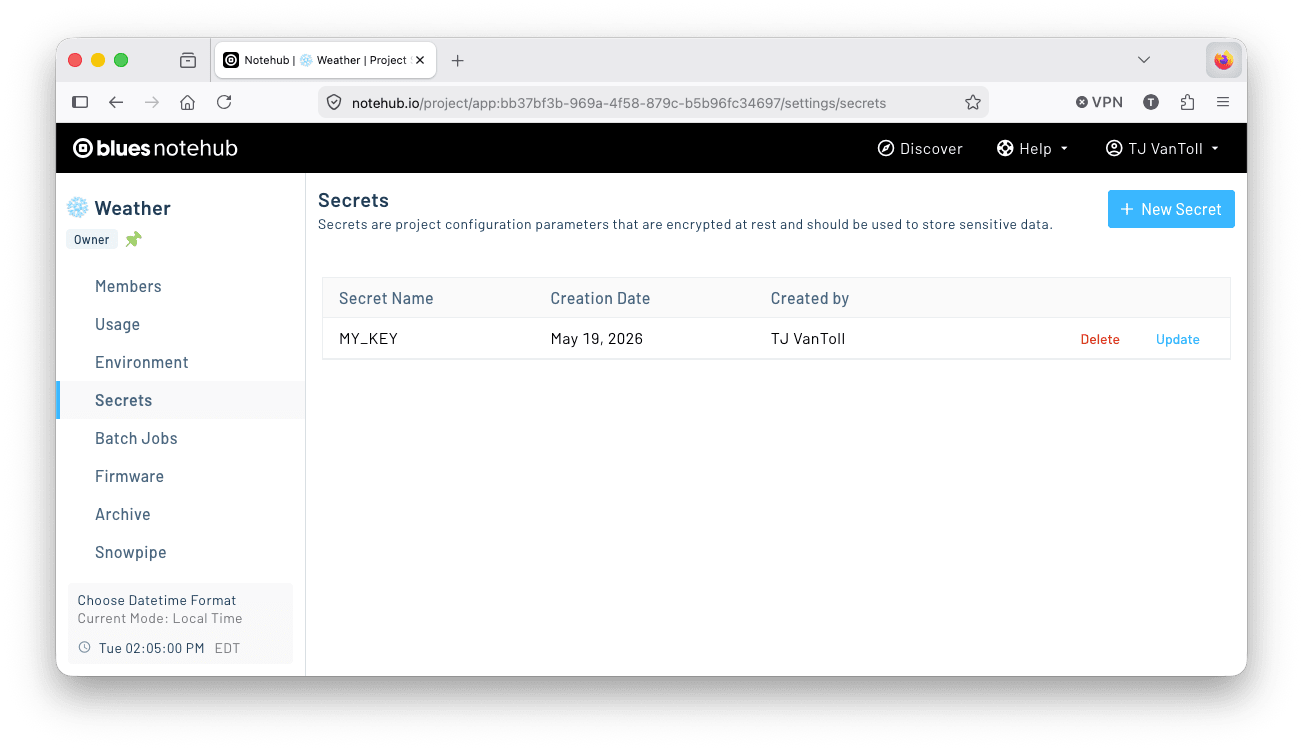
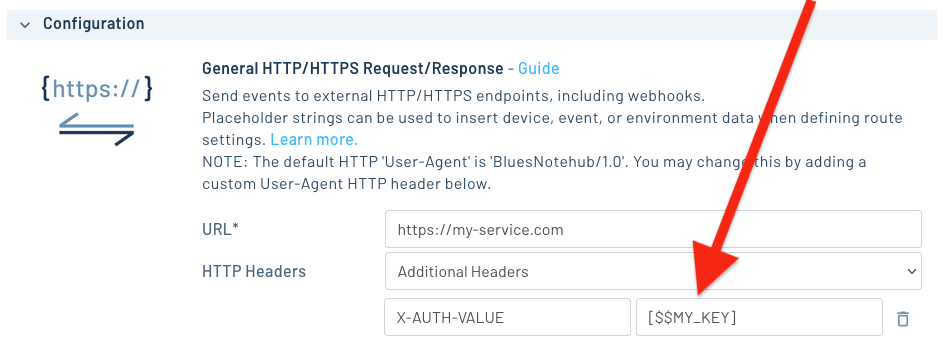
For example, suppose the MY_KEY secret shown in the screenshot above contains a token your route needs to authenticate with an HTTP server. After creating the secret, you can reference it in your route configuration using a $$ placeholder variable, and Notehub will substitute the secret value at runtime.
We recommend switching any custom secrets you use in Notehub routes to the new encrypted approach shown above as soon as practical. This ensures those values are encrypted at rest, only decrypted when a route fires, and never exposed again through the Notehub UI or API after they’re saved.
Notehub automatically encrypts known secret values used in routes, such as AWS access keys, Azure secret keys, Slack bearer tokens, and so forth.
The secrets workflow described above is intended for custom values you add to your routes, such as tokens, credentials, or keys that are not already handled by a route’s built-in secret fields.
Project secrets are also fully manageable via API:
- Get Project Secrets — list all secrets on a project.
- Create Project Secret — create a new secret.
- Update Project Secret — update an existing secret's value.
- Delete Project Secret — delete a secret.
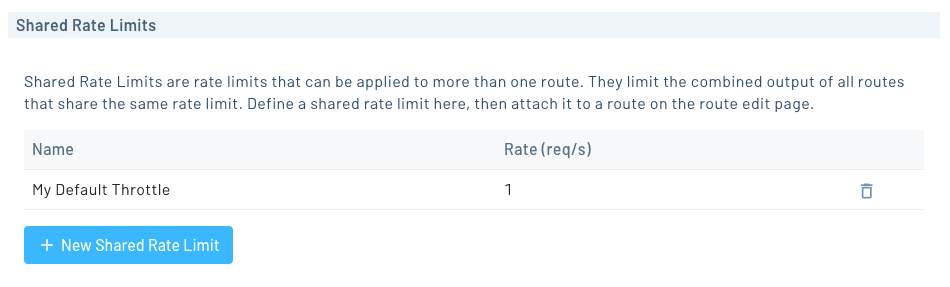
And then next, the last routing improvement I want to mention is a new feature called Shared Rate Limits. A shared rate limit is a named, project-scoped throttle (configured as a number of milliseconds between requests) that you can attach to as many routes as you want.
You can create a shared rate limit in your project’s Settings.
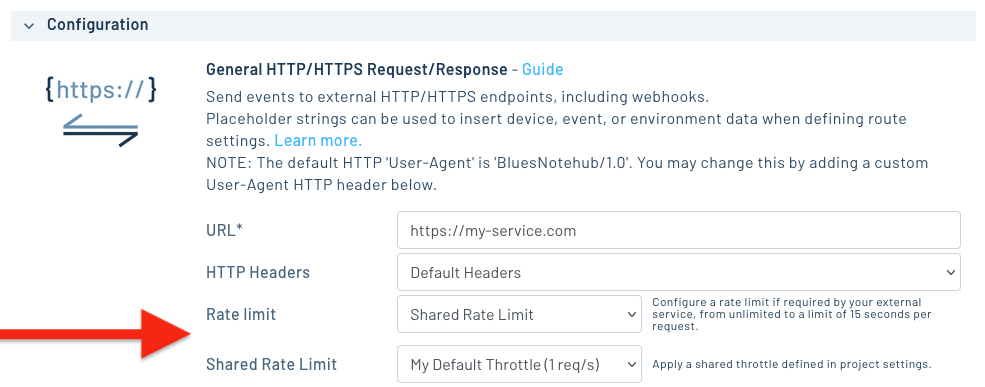
And then apply them to any route by setting its Rate limit to Shared Rate Limit.
Learn more about how rate limiting works in Notehub in Rate Limiting Routes.
API Improvements
The last thing I want to cover is a set of API improvements we’ve added over the last few months to make Notehub easier to integrate into your existing tools and automation workflows.
Host Firmware Update and Delete APIs
There are now two new endpoints for managing host firmware binaries programmatically:
- Update Firmware allows you to update metadata (
info,notes,version) on already uploaded host firmware. - Delete Firmware lets you delete host firmware binaries.
Together with existing APIs like Upload Firmware, Get Available Firmware, Perform DFU Action, and Get Device DFU Status, these new endpoints give you a more complete API surface for building your own DFU workflows and automations.
If you want to create custom firmware-update workflows with the Notehub API, these previous blog posts offer helpful walkthroughs:
Batch Job APIs
We’ve also added a new set of endpoints for working with batch jobs, which are Notehub jobs that can provision, configure, and report on large sets of devices.
When we shipped batch jobs last year, the only way to create and run them was through the Notehub UI. With the new Jobs APIs, you can now manage the full lifecycle programmatically:
- Create Job — create a new job.
- Get Jobs — list all jobs on a project.
- Get Job — get the details of a specific job.
- Delete Job — delete a job.
- Run Job — run a job.
- Get Job Runs — list a job’s previous runs.
- Get Job Run — get the report from a specific run.
- Cancel Job Run — cancel an in-progress run.
If you’ve been using batch jobs to automate device, fleet, or project tasks, these endpoints should help you wire that work into scripts or your own internal tools.
What’s Next?
Last but not least, a quick teaser.
We’ve been working on a major new Notehub feature focused on Analytics—giving you a richer, more visual way to understand usage data in your Notehub project without having to build your own dashboards on top of the Notehub API.
Specifically, at the project level you’ll be able to view analytics on event usage, data usage, device reboots, firmware updates, route usage, and more.
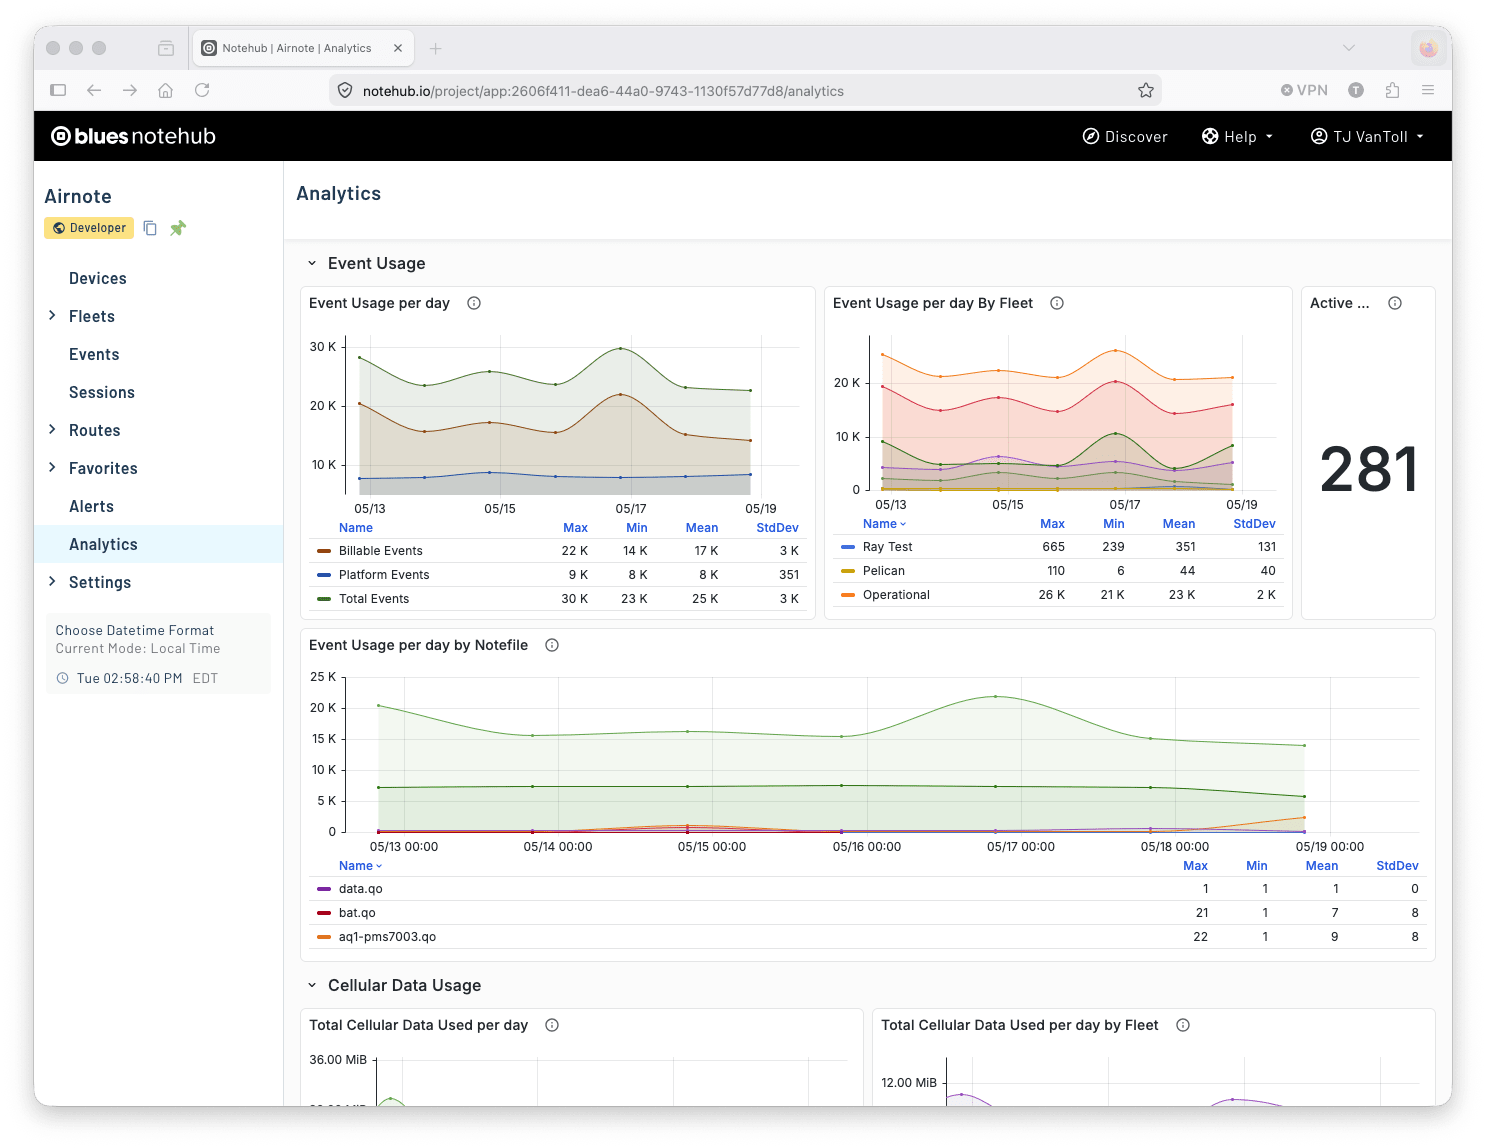
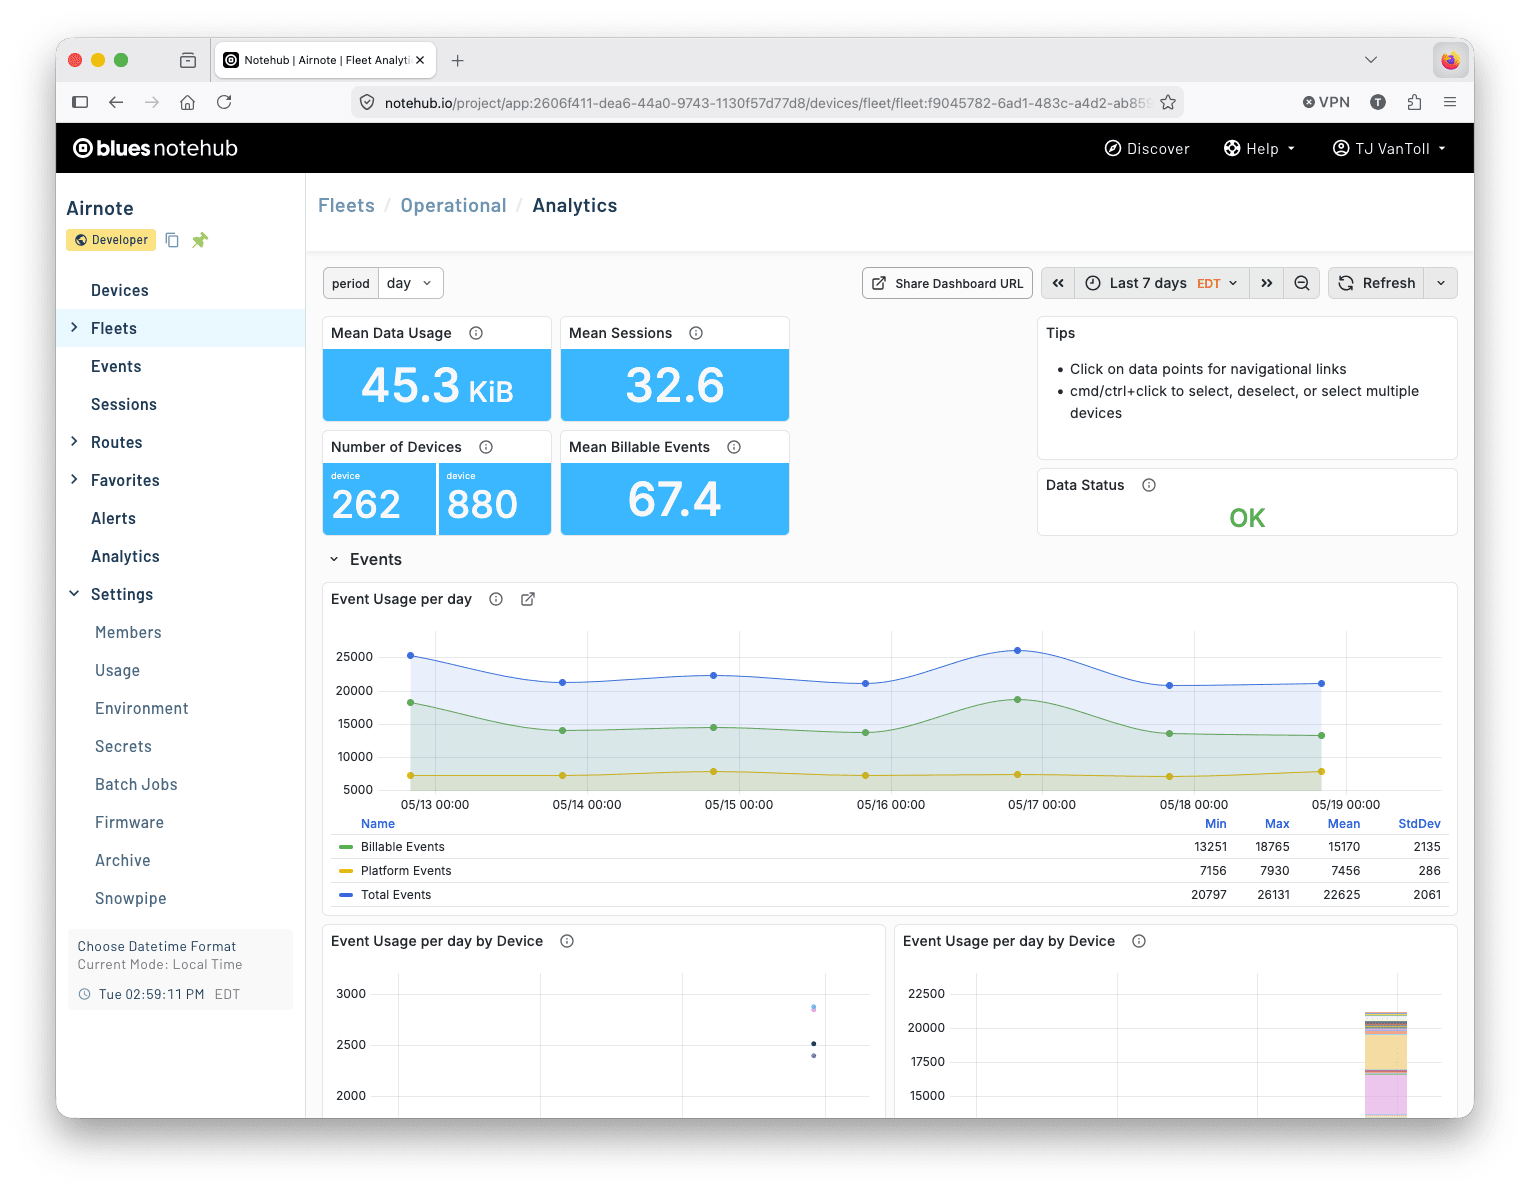
And at the fleet level you’ll be able to view much of the same information, but filtered to devices that are a part of the selected fleet.
We’re rolling out this feature to select customers to get feedback before opening it to everyone. To request access you can visit your project’s Analytics page and follow the next steps listed there.
Wrapping Up
Phew. That’s the rundown of what’s new in Notehub this time. Give these features a shot on your own projects, and as always—if you have feedback, requests, or ideas for what we should build next, let us know in our community forum.