Routing Data to Cloud: AWS IoT Analytics
Watch a video of this tutorial
In previous tutorials you've learned about the Blues Notecard, and used it to collect data and send it to Notehub, the Blues cloud service.
One powerful feature of Notehub is routes, which allow you to forward your data from Notehub to a public cloud like AWS, Azure, or Google Cloud, to a data cloud like Snowflake, to dashboarding services like Datacake or Ubidots, or to a custom HTTP or MQTT-based endpoint. The tutorial below guides you through sending data to several popular services, and teaches you how to build visualizations using that data.
Don't see a cloud or backend that you need? Notehub is able to route data to virtually any provider. If you're having trouble setting up a route, reach out in our forum and we will help you out.
Introduction
This tutorial should take approximately 30-40 minutes to complete.
In this tutorial, you'll learn how to connect your Notecard-powered app to AWS IoT Analytics, and learn how to start creating simple visualizations with sensor data.
This tutorial assumes you've already completed the initial
Sensor Tutorial to capture
sensor data, saved it in a Notefile called
sensors.qo, and sent that data through the Notecard to Notehub (or that
you've already created your own app with sensor data and are ready to connect
your app to external services).
Create a Route
A Route is an external API, or server location, where Notes can be forwarded upon receipt.
Routes are defined in Notehub for a Project and can target Notes from one or more Fleets or all Devices. A Project can have multiple routes defined and active at any one time.
Before you create a Route, ensure the data you want to route is available in Notehub by navigating to the Events view.

We'll start with a simple route that will pass Notecard events through to webhook.site, where you can view the full payload sent by Notehub. Using this service is a useful way to debug routes, add a simple health-check endpoint to your app, and familiarize yourself with Notehub's Routing capabilities.
-
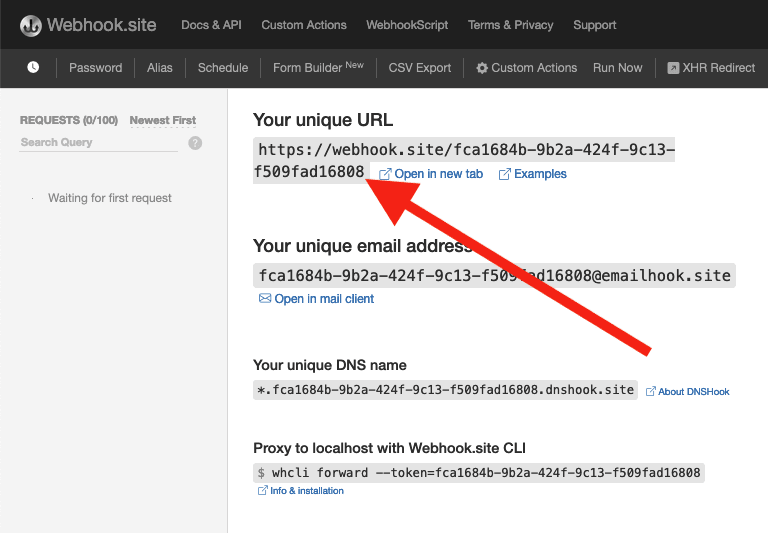
Navigate to webhook.site. When the page loads, you'll be presented with a unique URL that you can use as a Route destination. Copy that URL for the next step.
-
Navigate to the Notehub.io project for which you want to create a route and click on the Routes menu item in the left nav.
-
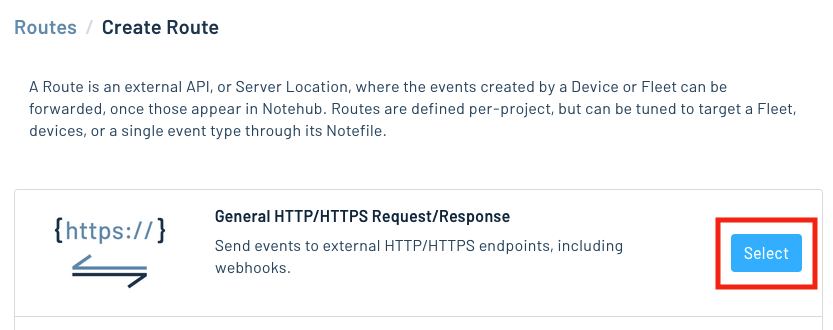
Click Create Route.

-
Select the General HTTP/HTTPS Request/Response route type.
-
Give the route a name (for example, "Health").

-
For the Route URL, use the unique URL you obtained from webhook.site.

-
In the Notefiles dropdown, choose Select Notefiles and enter the name of the Notefile to monitor. For example, we used
sensors.qofor the sensor tutorial.
-
Make sure the Enabled switch remains selected, and click Create Route.
-
Return to webhook.site. This page will update automatically with data from your Notecard as it is received in Notehub. The data from your sensor is contained within the
bodyattribute. Notice that Notehub provides you with a lot of information, by default. In the next section, we'll look at using transformations to customize what Notehub sends in a Route.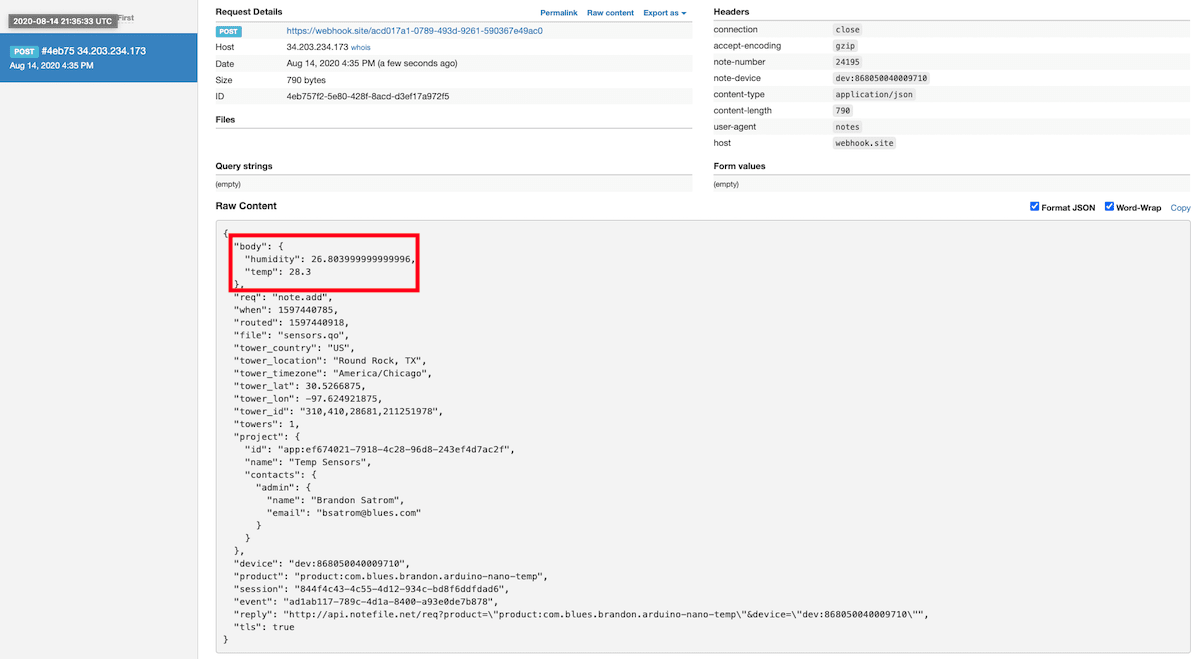
Use JSONata to Transform JSON
Before moving on to routing data to another external service, let's briefly explore using JSONata to transform the data Notehub routes.
As mentioned above, Notehub provides a lot of information in each Route request. You may want to trim down what you send to the external service, or you might need to transform the payload to adhere to a format expected by that service. Either way, Notehub supports shaping the data sent to a Route using JSONata.
More About JSONata
To learn more about JSONata, have a look at the Blues JSONata Guide.
Transform Your Data
Let's try a simple query to the webhook.site route created in the last section.
-
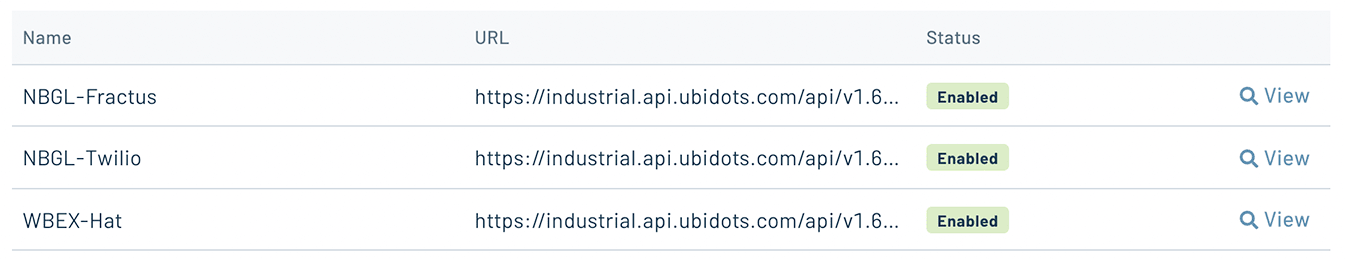
Navigate to the Routes page in Notehub and click View next to the Route you wish to edit.
-
In the Transform JSON drop-down, select JSONata Expression.

-
In the JSONata expression text area, add the following query to select the temp and humidity from the body, create a location field that concatenates the
tower_locationandtower_countryfields, and create a time field.{ "temp": body.temp, "humidity": body.humidity, "location": tower_location & ', ' & tower_country, "time": when } -
Click Save Route. Then, navigate back to your webhook.site url. As requests come in, you'll see your custom, JSONata-transformed payload in the Raw Content section.

JSONata is simple, powerful, and flexible, and will come in handy as you create Routes for your external services. To explore JSONata further, visit our JSON Fundamentals guide.
Route to an External Service
Now that you've created your first Route and learned how to use JSONata to shape the data sent by a Route, you'll connect Notehub to an external service.
For this tutorial, you'll connect your app to AWS IoT Analytics, a secure, scalable IoT app platform that allows you to manage IoT devices, create dashboards and visualizations, and more.
Create an AWS Account
If you don't have one already, first create an AWS account. Then, log in to your AWS Management Console.
Create an IAM User
You will need to specify a user, to which you can provide programmatic API access.
-
First, navigate to Identity and Access Management.
-
Click Access Management > Users from the left navigation bar.

-
Now, click Add user.

-
Give the new user a name (for example, "blues_notehub"). Click Next to continue.

-
Select the Attach existing policies directly button. Then, search for "awsiotanalytics", and select the AWSIoTAnalyticsFullAccess policy from the results.

-
Click Next. Review your selection, and click Create user.

-
Now the user is created, we need to add an API key to allow the Notehub to speak to AWS IoT Analytics directly. Click View User.

-
Select the Security Credentials Tab.

-
Click Create Access Key.

-
Select Application running outside AWS as the usecase, and review the security guidance. Click Next.

- No description is required, click Create Access Key

- Click Show to view your Secret access key. It is also reccomended that you download the credentials by clicking on Download .csv file. Click Done to finish.

 note
noteMake sure you save your secret access key. You will never be able to see its value again, and it is required when setting up the route through Notehub.
Establish AWS IoT Analytics Application
Before a Route can be created in Notehub, you will need to create an AWS IoT Analytics application, to which you shall route data.
Create Basic Resources
As you work with AWS IoT Analytics, it's helpful to understand some terminology. Data flows into AWS IoT Analytics through a channel. Then, the data is updated as it flows through a pipeline. Your data will permanently reside in a datastore, and it will be queried with a dataset.
-
Navigate to the IoT Analytics Landing Page.
-
In the Quick create IoT Analytics resources panel, enter a resource prefix (for example "notecard_sensors"). Then, press Quick Create.

The corresponding resources will be created on your behalf; a channel, pipeline, data store, and data set.

At this point, it's time to send data into AWS IoT Analytics from Notehub. Not only will this confirm your Notehub route has been configured correctly, but it will also enable AWS IoT Analytics to infer field names from sample data.
Create a Route in Notehub
With your IoT Application set up and middleware configured, the next step is to create a Route in Notehub. Once you've completed this step, you'll have successfully connected your IoT app from sensor to cloud application!
-
Navigate to your project at Notehub.io.
-
Open the Routes dashboard in Notehub and click the Create Route button.
-
Select AWS as a route type.

-
Give your route a name in the Name your route field.
-
Set the route's Type to IoT Analytics.
-
Fill in the IoT Analytics Channel (i.e. the name of the channel you just created), Access Key ID, and Secret Access Key, and Region fields with the values generated during AWS IoT Analytics application creation.
noteYou can find the Region by viewing the details of any channel, pipeline, or datastore you just created in the AWS console. Each has an Amazon Resource Name (ARN) that includes the AWS region.
For example, in this ARN:
arn:aws:iotanalytics:us-east-1:7348937:pipeline/notecard_pipeline, "us-east-1" is the AWS region.
-
For the Notefiles field, select the Select Notefiles option and enter
sensors.qoin the Select Notefiles field.
-
For the Transform JSON field, select "JSONata Expression." Then enter the following transformation in the textarea below and click the Create Route button.
{
  "device": {
    "deviceId": device
  },
  "measurements": {
    "temp": body.temp,
    "humidity": body.humidity
  },
  "timestamp": $fromMillis(when * 1000)
}The AWS IoT Analytics API requires the following message format:

channelName is loaded from the configuration you supplied to Notehub. Notehub
sends each message individually, so the messages array contains one element.
messageId is used to uniquely identify each element of the array (always one
in this case), and is created on your behalf. Finally, the JSONata expression
crafted above, equates to the "value" associated with the payload key.
-
Navigate to the Events page, and wait for a sensor event to show up from your Device. Once it does, you can click on the event, then the "Route Log" tab to make sure everything is properly configured. If the response object contains a status of
200, then you are ready to move onto the final step: configuring the pipeline channel in your AWS IoT Analytics application.
Finalize AWS IoT Analytics Application
Update the Pipeline
-
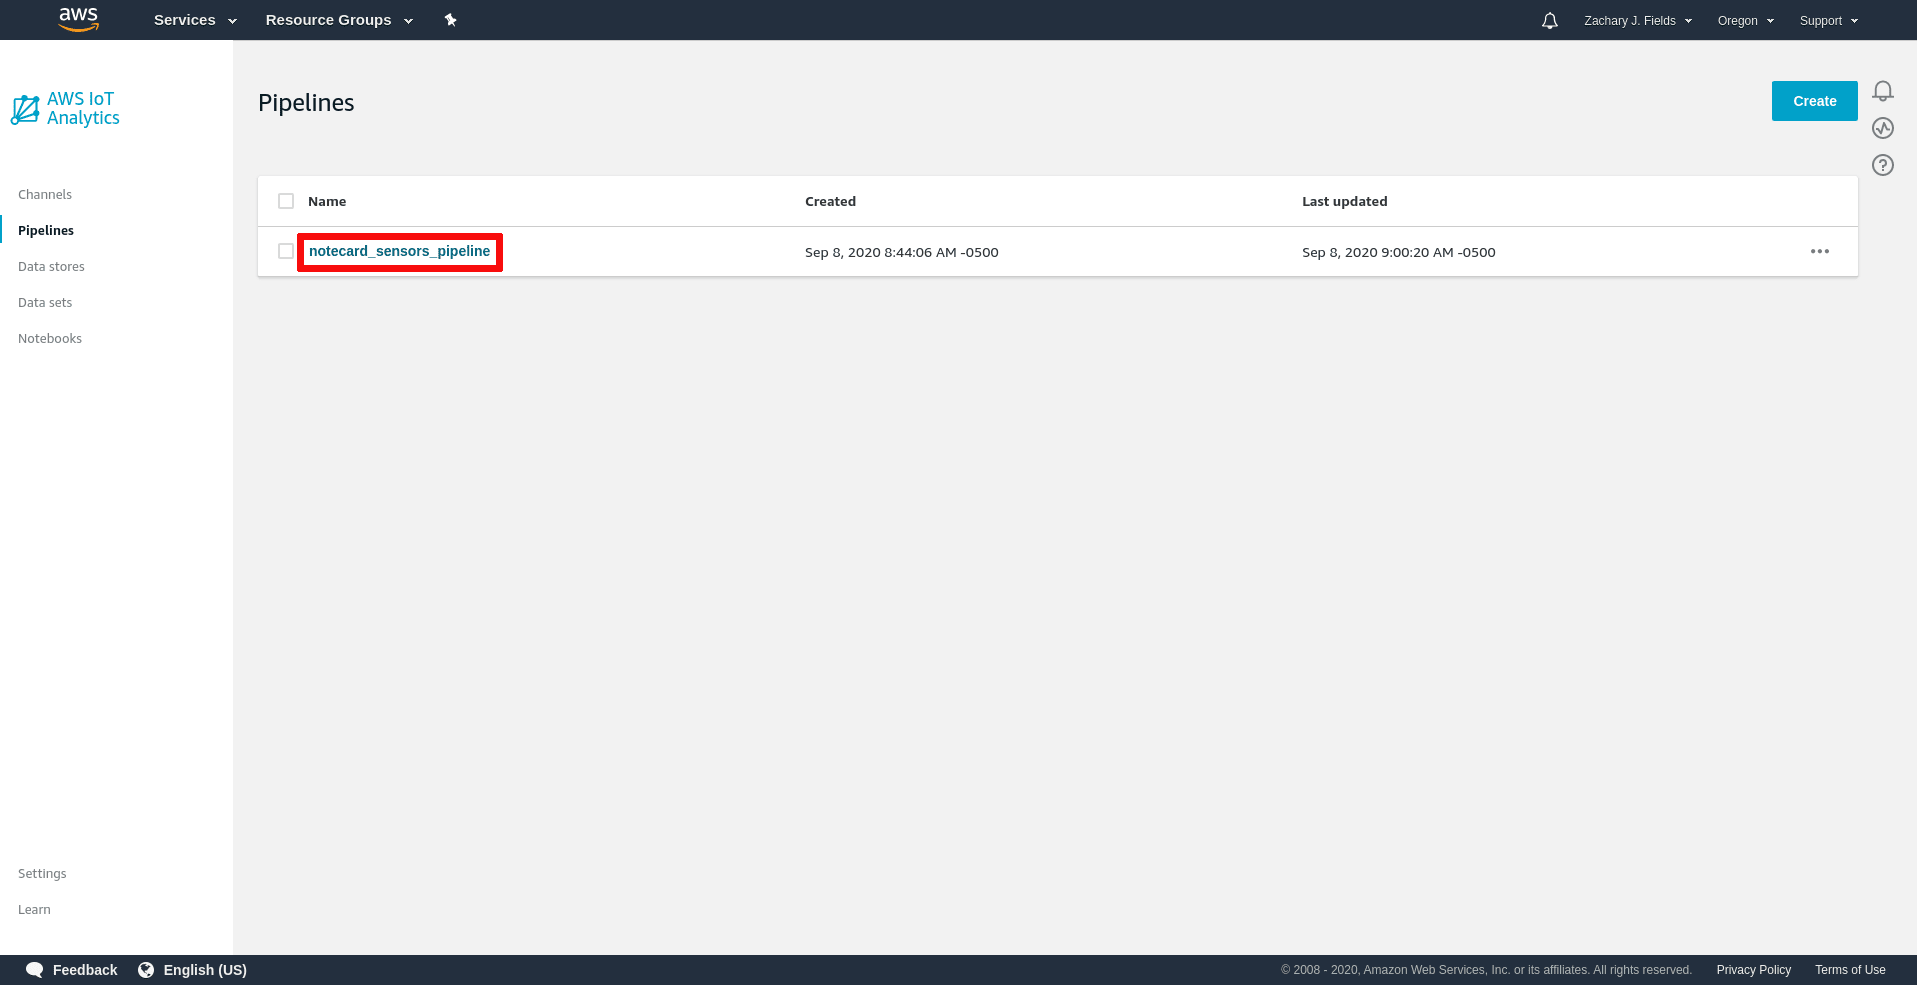
Now that you have data available in AWS IoT Analytics, you need to configure a pipeline to transform the data into the values that should be held in your data store. Select Pipelines from the navigation bar on the left.

-
Click on the name of your pipeline from the list.
-
Click Edit to the right of the Activities heading.

-
AWS IoT Analytics will make use of the data routed from Notehub and automatically infer field names, which is less error prone than entering the field names manually.

After the pipeline has inferred the field names, you will need to select which of the incoming fields we would like to retain in your data store. Select the
deviceId,humidity,temp, andtimestampfields from the list and click Next.
-
Now that you have selected your fields, it's time to add them to an activity. Click on Add activity.

-
Select Select attributes from the message from the list of available transforms.

-
Under the Select message attributes section, select the fields
deviceId,humidity,temp, andtimestamp. Click on Update preview, validate the output, and click Save changes.
-
Now that the pipeline has been configured, you will be prompted to reprocess your messages. Before reprocessing, update the range of messages to reprocess.

noteThe default values in the range fields are backward. The date on the top is the
start time, and the date on the bottom is end time. Set the start time (top) to
00:00 and the end time (bottom) to 23:00 to reprocess all the messages you
have sent today.
Update the Dataset
-
Back at the IoT Analytics Landing Page, select Data sets from the navigation bar on the left.

-
Click on the name of your data set from the list.

-
Select Actions > Run Now to populate the data set. This makes your data available to other AWS services, such as AWS QuickSight.

As soon as the data set finishes processing, you will be able to see a sample displayed in a new section named Result preview will be displayed beneath the Delta window section.

Congratulations, your AWS IoT Analytics application is set up and ready to send data throughout the Amazon ecosystem!
Build Data Visualizations
Now that you have connected your Notecard to AWS IoT Analytics, you can leverage the power of the AWS Ecosystem and set up an AWS QuickSight Dashboard to visualize your data.
Create an AWS QuickSight account
-
First navigate the AWS QuickSight page, and sign up for an AWS QuickSight account.

-
Choose the Standard Plan.

-
Configure your account. Match the value in the QuickSight region field to the region where your IoT Analytics account was created. Also, be sure to select the AWS IoT Analytics checkbox. Finally, give your account a name, and click the Finish button.

Add Your Data Set
-
Now let's add a simple line chart to show historical readings, over time. Click the New analysis button from your AWS Quicksight Landing Page.

-
Initially, your IoT Analytics won't show up in Your Data Sets, so you need to click the New dataset button.

-
Select AWS IoT Analytics from the list of possible data sources.

-
Choose your data set from the available list ("notecard_sensors_dataset" shown below).

-
Review the "Finish data set creation" screen, and click Visualize.

Create a Dashboard
Now, it's time to create a graph for viewing data over time, as well as gauge to view of the average of the values we have obtained. In this final section, we'll add cards to show multiple view of the temperature and humidity values.
-
After selecting your data set, you will see the analysis home screen.

-
Select the line chart icon from the Visual types section.

-
Drag both
tempandhumidityfrom the Field list in the left navigation bar to the Value box in the Field wells section, and dragtimestampfrom the Field list to the X axis box.
-
To better visualize your readings, select Aggregate: > Minute for
timestamp.
-
Time to add another visual to our dashboard. Click the Duplicate visual from the options on the visual itself.

-
Create a average temperature visual on your dashboard.
-
In the Field wells section, remove
humidityfrom the Value box, and removetimefrom the X axis box. Then, select the gauge chart icon from the Visual types section.
-
Select Aggregate: > Average for
tempin the Field wells section.
-
-
Now duplicate the temperature gauge, and change
temp (Average)tohumidity (Average). Then resize and arrange your visualizations, and you have completed your dashboard!
Next Steps
Congratulations! You've created your first Route and connected your Notecard app to an external service.
If you're following the Blues Quickstart, you're done! But we do have some suggestions for next steps:
- Browse the Blues Accelerators to find purpose-built, free and open source IoT solutions.
- Bookmark the Notecard API for quick reference.
- Follow the Notehub Walkthrough to get more out of using Notehub.
At any time, if you find yourself stuck, please reach out on the community forum.
