Routing Data to Cloud: Azure IoT Central
Watch a video of this tutorial
In previous tutorials you've learned about the Blues Notecard, and used it to collect data and send it to Notehub, the Blues cloud service.
One powerful feature of Notehub is routes, which allow you to forward your data from Notehub to a public cloud like AWS, Azure, or Google Cloud, to a data cloud like Snowflake, to dashboarding services like Datacake or Ubidots, or to a custom HTTP or MQTT-based endpoint. The tutorial below guides you through sending data to several popular services, and teaches you how to build visualizations using that data.
Don't see a cloud or backend that you need? Notehub is able to route data to virtually any provider. If you're having trouble setting up a route, reach out in our forum and we will help you out.
Introduction
This tutorial should take approximately 30-40 minutes to complete.
In this tutorial, you'll learn how to connect your Notecard-powered app to Azure IoT Central, and learn how to start creating simple visualizations with sensor data.
This tutorial assumes you've already completed the initial
Sensor Tutorial to capture
sensor data, saved it in a Notefile called
sensors.qo, and sent that data through the Notecard to Notehub (or that
you've already created your own app with sensor data and are ready to connect
your app to external services).
Create a Route
A Route is an external API, or server location, where Notes can be forwarded upon receipt.
Routes are defined in Notehub for a Project and can target Notes from one or more Fleets or all Devices. A Project can have multiple routes defined and active at any one time.
Before you create a Route, ensure the data you want to route is available in Notehub by navigating to the Events view:

We'll start with a simple route that will pass Notecard events through to webhook.site, where you can view the full payload sent by Notehub. Using this service is a useful way to debug routes, add a simple health-check endpoint to your app, and familiarize yourself with Notehub's Routing capabilities.
-
Navigate to webhook.site. When the page loads, you'll be presented with a unique URL that you can use as a Route destination. Copy that URL for the next step.

-
Navigate to the Notehub.io project for which you want to create a route and click on the Routes menu item in the left nav.
-
Click Create Route.

-
Select the General HTTP/HTTPS Request/Response route type.

-
Give the route a name (for example, "Health").

-
For the Route URL, use the unique URL you obtained from webhook.site.

-
In the Filters section, choose Selected Notefiles and check the box(es) next to the Notefile(s) you want to route. For example, we used
sensors.qofor the sensor tutorial.
-
Make sure the Enabled switch at the top remains selected, and click Create Route.
-
Only Notes received after the Route is created are routed automatically. If new Notes have been received since you created the Route, proceed to the next step.
Alternatively, you can manually route existing Notes by (1) checking the box next to an event, (2) clicking the Route button, and (3) choosing the Route you would like to use:

-
Return to webhook.site. This page will update automatically with data sent from Notehub. The data from your sensor is contained within the
bodyattribute. Notice that Notehub provides you with a lot of information, by default. In the next section, we'll look at using transformations to customize what Notehub sends in a Route.
Use JSONata to Transform JSON
Before moving on to routing data to an external service, let's briefly explore using JSONata expressions to transform the data Notehub routes.
As mentioned above, Notehub provides a lot of information in each Route request. You may want to trim down what you send to the external service, or you might need to transform the payload to adhere to a format expected by that service. Either way, Notehub supports shaping the data sent to a Route using JSONata.
To learn more about JSONata later, have a look at the Blues JSONata Guide.
Transform Your Data
Let's try a simple query to the webhook.site Route created in the last section.
-
Navigate to the Routes page in Notehub and click on the Route you wish to edit.

-
In the Transform Data drop-down, select JSONata Expression.

-
In the JSONata Expression text area, add the following query to select the
tempandhumidityfrom thebody, create alocationfield that concatenates thetower_locationandtower_countryfields, and create atimefield.{ "temp": body.temp, "humidity": body.humidity, "location": tower_location & ', ' & tower_country, "time": when } -
Click Apply changes. Then, navigate back to webhook.site. As requests come in, you'll see your custom, JSONata-transformed payload in the Raw Content section.

 note
noteThe
tower_locationandtower_countryfields are only populated for events sent over cellular. For Starnote/satellite, LoRa or WiFi devices, those fields will be empty. If you want a single expression that works across connectivity types, use thebest_locationandbest_countryfields instead — Notehub appends those to every event, choosing the most accurate source available (GPS/GNSS, triangulation, or cell tower). See Data Notehub Appends to Events to learn more.
JSONata is simple, powerful, and flexible, and will come in handy as you create Routes for your external services. To explore JSONata further, visit our Blues JSONata Guide.
Route to an External Service
Now that you've created your first Route and learned how to use JSONata to shape the data sent by a Route, you can connect Notehub to an external service.
For this tutorial, you'll connect your app to Azure IoT Central, a ready-made UX and API surface for connecting and managing devices at scale, delivering reliable data for business insights.
Create an Azure Account
If you don't have one already, first create an Azure account. Then, log in to your Azure Portal.
Create an IoT Central Application
-
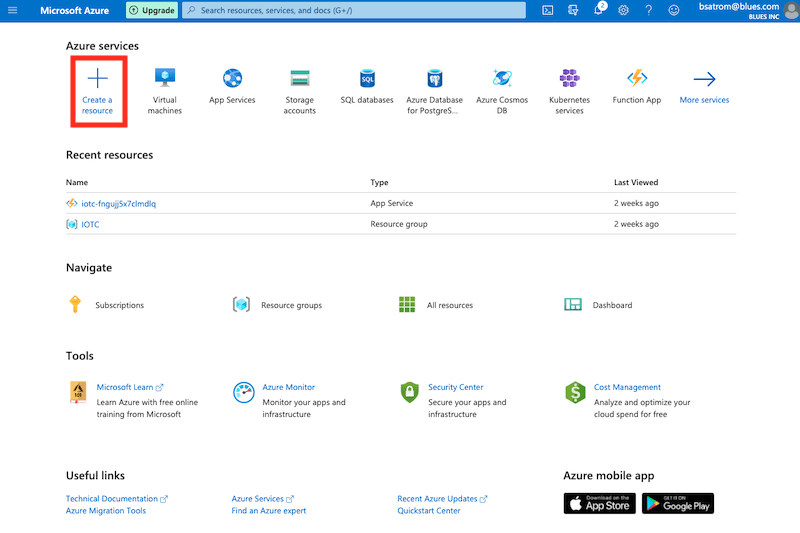
Once you're logged in, click the Create a resource link on the Portal dashboard.
-
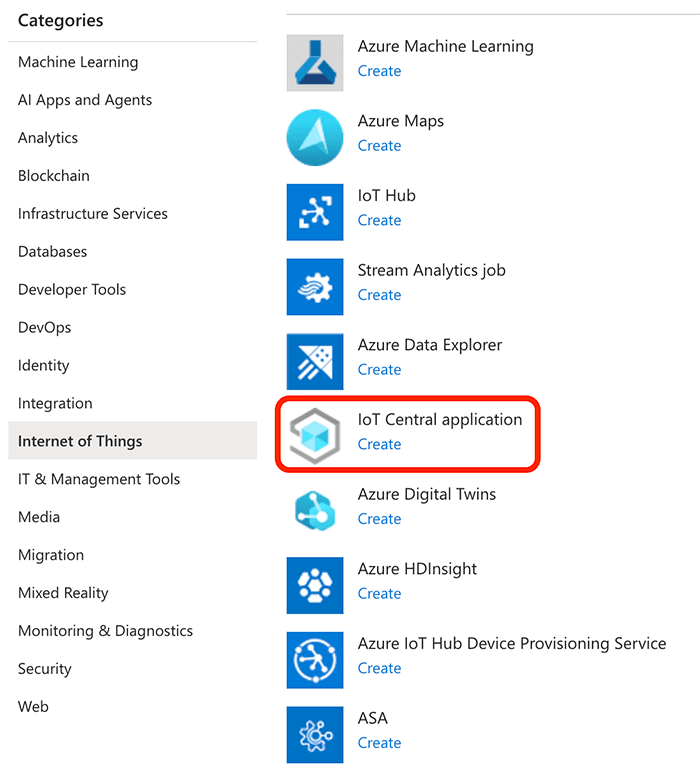
Next, click the Internet of Things category and select IoT Central application.
-
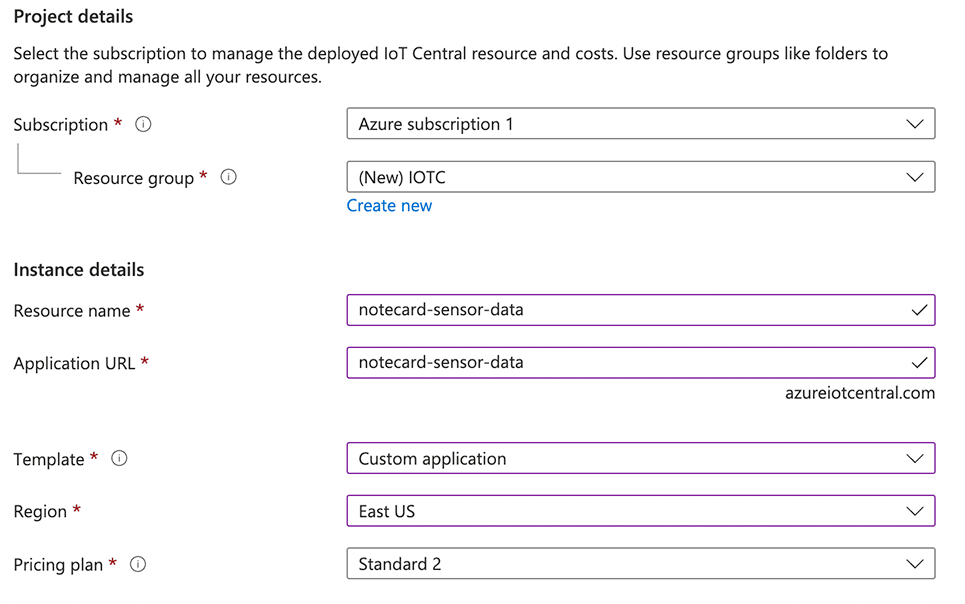
On the configuration screen, fill out all of the required fields, keeping in mind the Resource name and Application URL must be globally unique values. Be sure to choose Custom application in the Template drop-down. Finally, click Review + create.
-
The resources needed for your IoT Central application will be created in the background. When the deployment complete screen loads, click the Go to resource button.

-
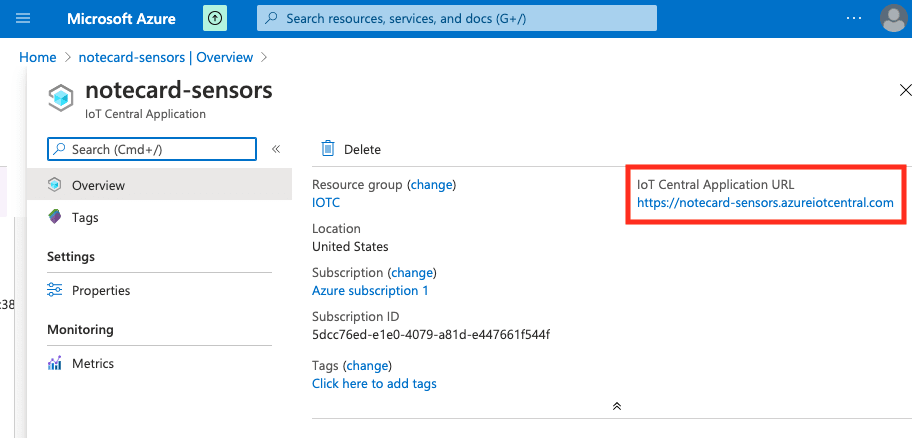
Next, click on the name of the resource you created. On the overview page, you'll see the IoT Central Application URL in the top-right corner. Click it to open your IoT Central Application.
Create a Notecard Device Template
In order to begin ingesting sensor data into your IoT Central application, you'll need to create a device template.
-
Click the Device templates option on the IoT Central menu, and then Create a device template.
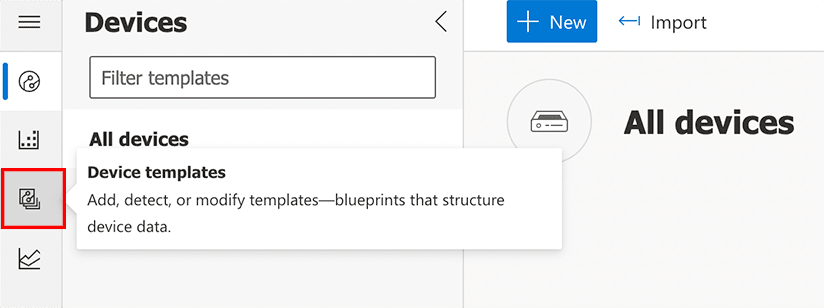
-
On the next screen, click the IoT device custom device tile and click the Next: Customize button.

-
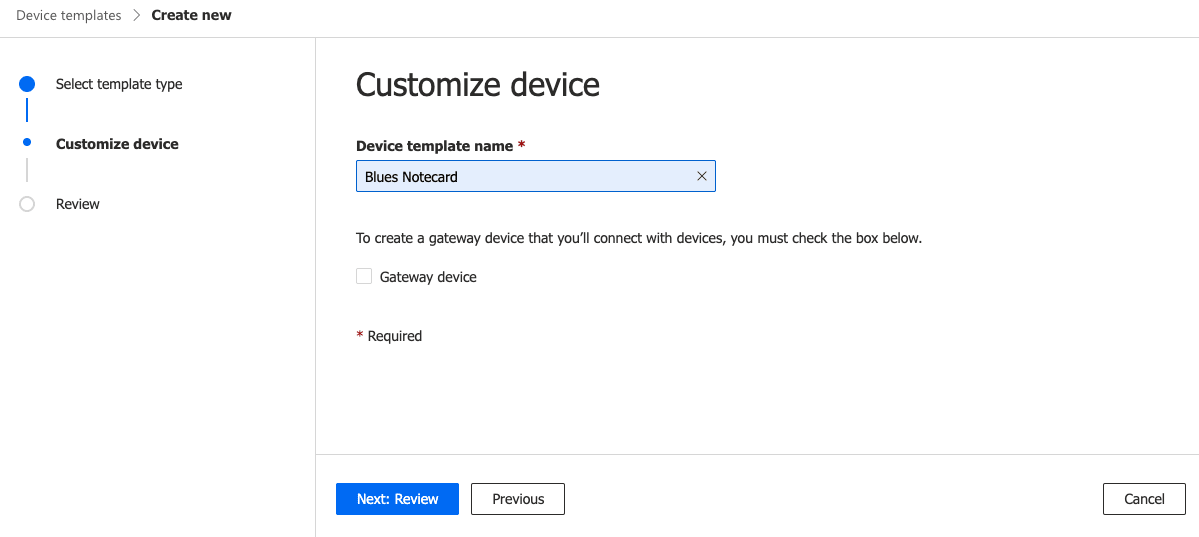
Give the template a name and click Next: Review.
-
On the review screen, click Create.

-
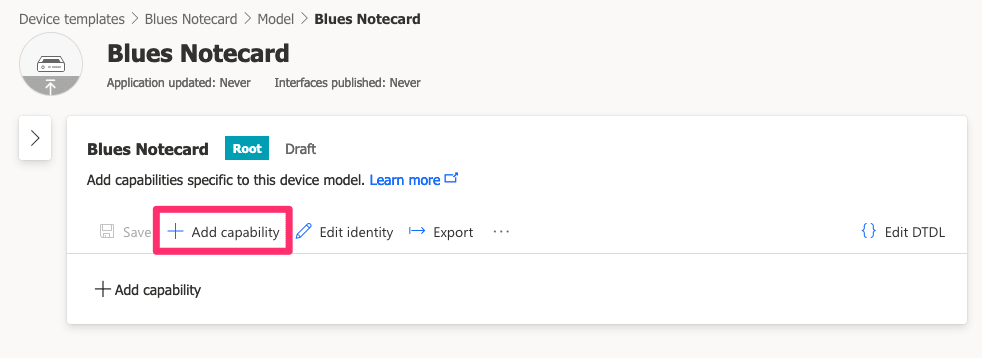
The primary purpose of the device template is to create a set of interfaces, capabilities, and telemetry that IoT Central uses to describe physical devices that connect to it. As such, the first thing we need to create is a model. Click the Custom model tile to create a new model from scratch.

-
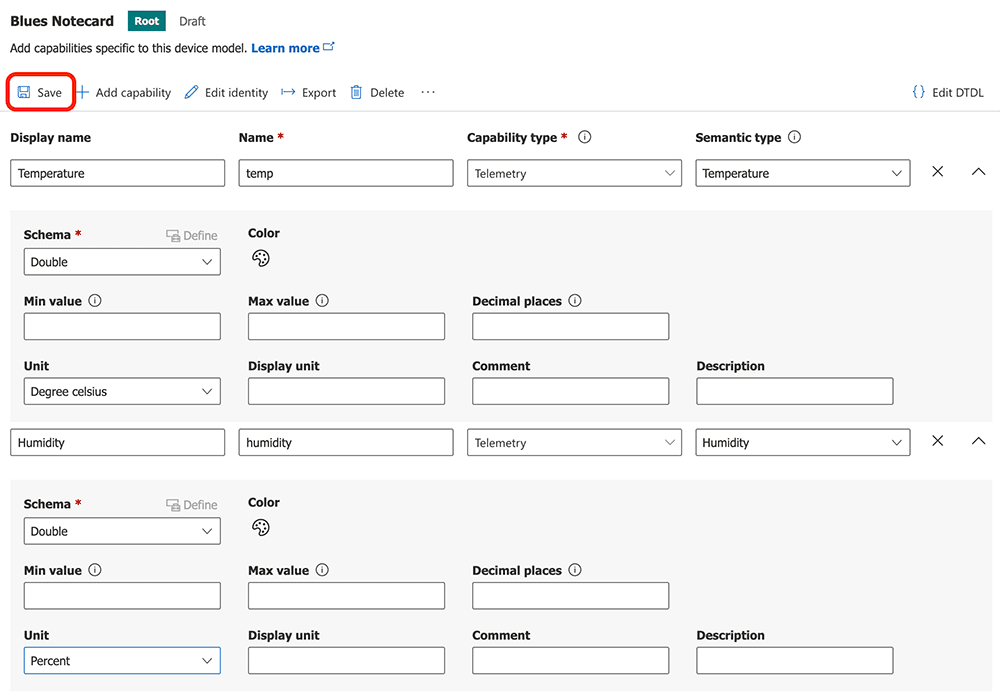
Now that you have the model, let's create capabilities to represent telemetry data. Specifically, you'll create capabilities for the temperature and humidity values captured from your sensors. Click the Add capability link.
-
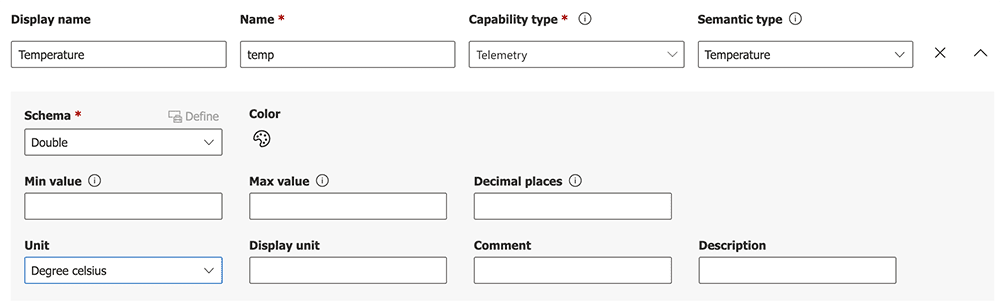
A form will appear on the screen asking for capability details. Enter the following values in the respective fields:
- Display name:
Temperature - Name:
temp - Capability type:
Telemetry - Semantic type:
Temperature - Schema:
Double - Unit:
Degree celsius
- Display name:
-
Click the Add Capability button and repeat this process for the humidity capability, using the values below:
- Display name:
Humidity - Name:
humidity - Capability type:
Telemetry - Semantic type:
Humidity - Schema:
Double - Unit:
Percent
When done, click Save.
- Display name:
-
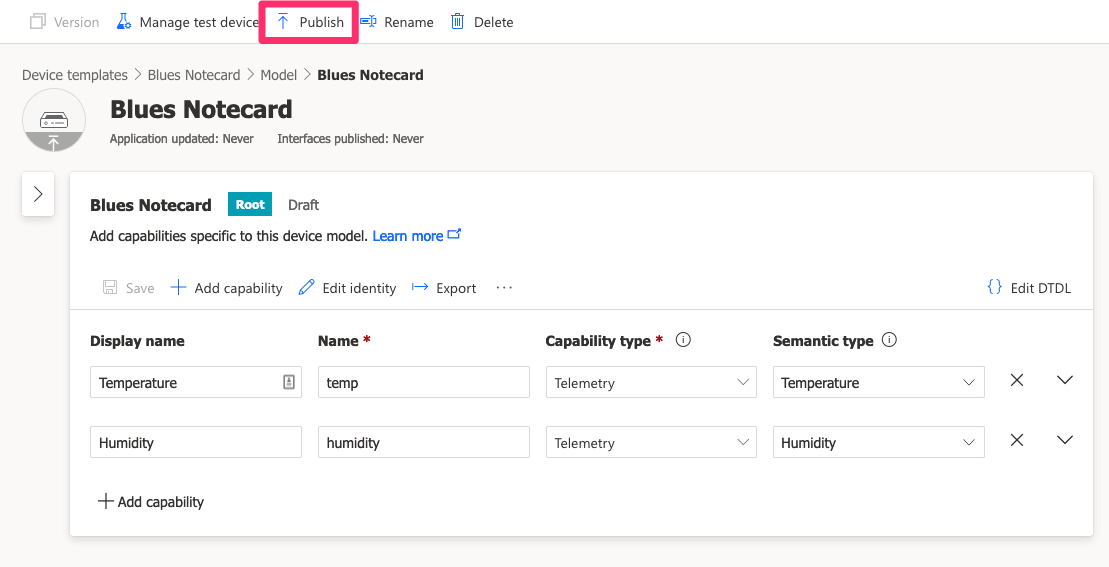
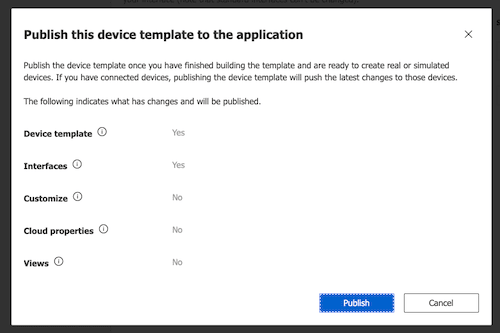
Finally, you'll need to publish your template so devices can be associated with it. Click the Publish link on the top toolbar, and Publish again in the confirmation modal.
Now that you have a published template, you are ready to create a device bridge application to connect Notehub to your IoT Central Application.
Configure the IoT Central Device Bridge
The Azure IoT Central Device Bridge is a middleware application that runs in Azure and forwards messages from your IoT devices to your IoT Central app. You can create your own middleware if you prefer, but we recommend the IoT Central Device Bridge because it provides a one-click deployment approach that includes a secure key vault for storing your IoT Central SAS tokens and a simple Node.js application for ingesting data.
-
To create a device bridge instance for your app, visit the Device Bridge GitHub repository and click the Deploy to Azure button.

-
That link will take you to a Custom deployment configuration screen in the Azure Portal, where you'll need to select a subscription, resource group, and region for deployment.

-
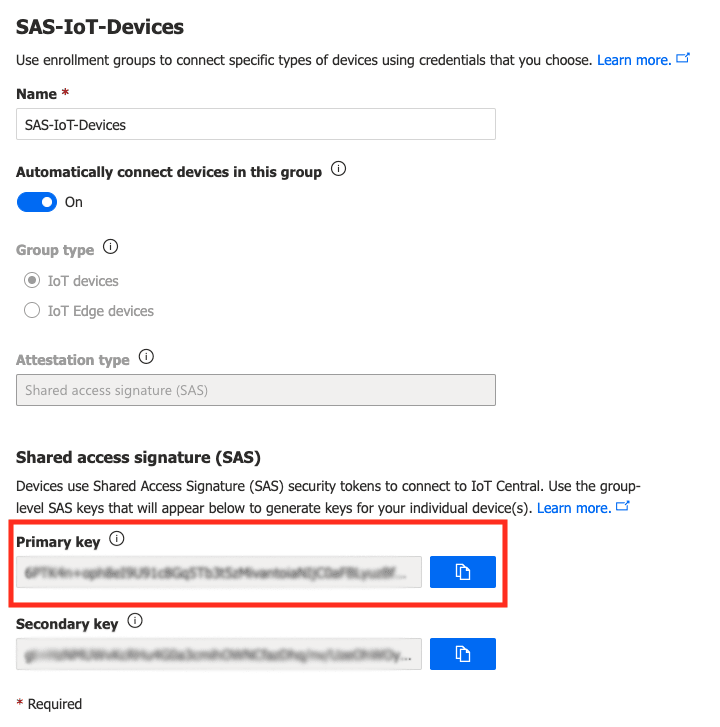
Next, you'll need to provide a Scope ID and IoT Central SAS Key for the middleware application. This allows it to route Notehub data into IoT Central. In a separate tab, return to your IoT Central application and navigate to Permissions > Device connection groups. Copy the ID scope value and paste it into the Scope ID field on the Custom deployment screen.

-
Now, click on the SAS-IoT-Devices enrollment group in the Device Connection setting screen of your IoT Central app. Copy the SAS Primary Key and enter it into the IoT Central SAS Key field on the Custom deployment screen.
-
After you've added all of the required fields on the Custom deployment screen, click Review + create. Then, click Create on the next screen.

-
The deployment will take a few moments, during which time you'll see Deployment is in progress on the overview page. Once the deployment completes, click the Go to resource group button.
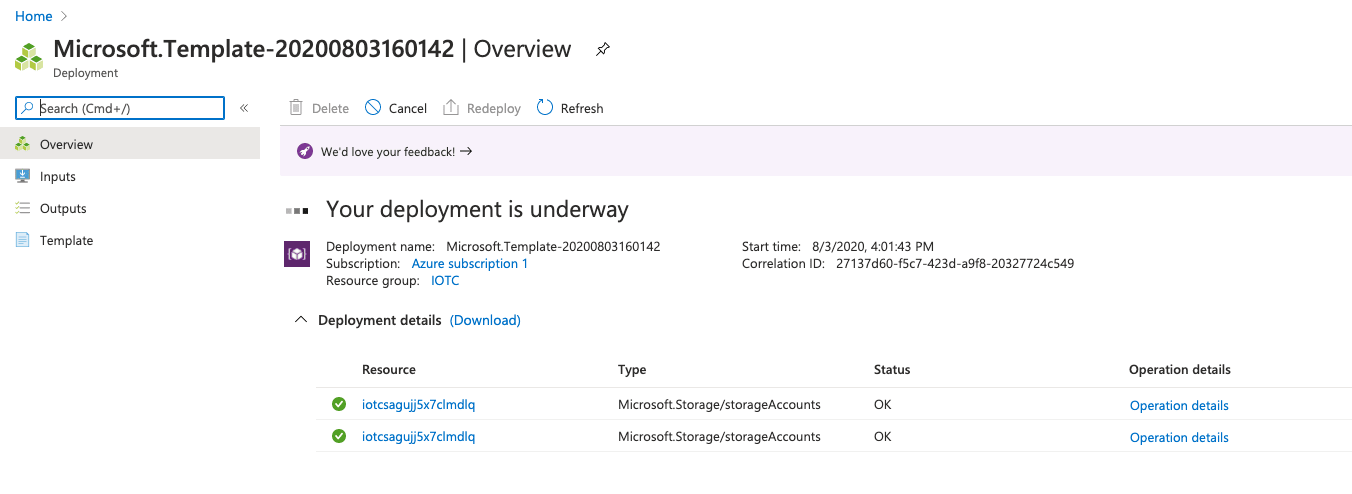
-
Now you'll need to open the Function App created during the previous step and install a number of dependencies. On your resource group dashboard, find your Function App and click its name to load it (you may have to click the Refresh button to see it).

-
In the left menu, find the Development Tools group and click the Environment variables menu item. Click the
WEBSITE_NODE_DEFAULT_VERSIONvariable and change the value to~20(reflecting the version of Node.js you want to use). Be sure to Apply any changes made. -
Remaining in the Development Tools group, click the Console menu item. This will load a sandboxed console environment in the browser.
-
At the prompt, type the following to install your application:
$cd IoTCIntegration && npm installNote: The process will take a few moments to complete and you may see a few warnings.
-
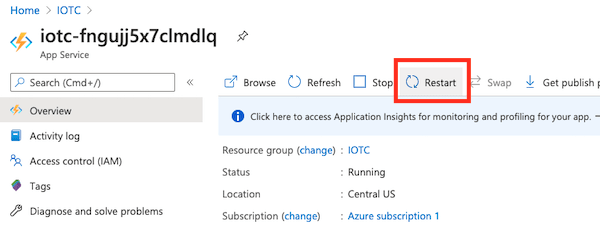
After the installation finishes, restart the Function App by clicking the Restart button on the Overview page.
-
Finally, you'll need the Function URL of your Function App in order to create a Route in Notehub. On your Function App dashboard, click the Functions menu item, then the name of your Function. Click the Get Function Url button on the top menu and copy the default (Function key) URL for the next step.

Create a Route in Notehub
With your IoT Application set up and middleware configured, the next step is to create a Route in Notehub.
-
Navigate to your project at Notehub.io.
-
Open the Routes dashboard in Notehub and click the Create Route button.
-
Select Azure as the route type.

-
Give the route a name in the Name your route field.
-
Set your route's Type to Function, then set the URL to the Azure Function App URL that you copied earlier.
 note
noteRouting Data to an Azure Function Secured by a Secret Key?
If you need to create a Route against an Azure Function secured by a secret key, first change your route Type to Function (Secret Key), and then provide your function key from the Azure portal in the Secret Key field.

-
For the Notefiles field, select the Selected Notefiles option and choose
sensors.qo. -
For the Transform JSON field, select JSONata Expression. Enter the following transformation in the textarea, which formats the incoming Note to conform to a structure that Azure IoT Central expects. Note that the
timestampfield is used to align the data ingested to IoT Central with the time it was captured on the Notecard, not when it was routed. After adding this expression, click Create Route.{ "device": { "deviceId": device }, "measurements": { "temp": body.temp, "humidity": body.humidity }, "timestamp": $fromMillis(when * 1000) } -
Navigate to the Events page, and wait for a sensor event to show up from your device. Once it does, click on the event, then the Route log tab to make sure everything is properly configured. If route log shows a status of
200, then you are ready to move onto the final step: approving your Device in the IoT Central app.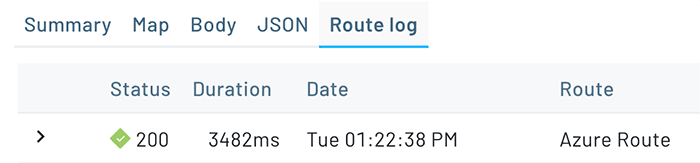 note
noteRemember, if you don't have any new Notes coming in to Notehub, you can always manually route existing Notes by (1) checking the box next to an event, (2) clicking the Route button, and (3) choosing the Route you would like to use.
Approve Device in IoT Central
If events are making it from the device bridge to your IoT Central app, the last step is to approve your device and associate it with your template.
-
On the Overview page for your IoT Central app resource, you'll see the IoT Central Application URL in the top-right corner. Click it to open your IoT Central Application.
-
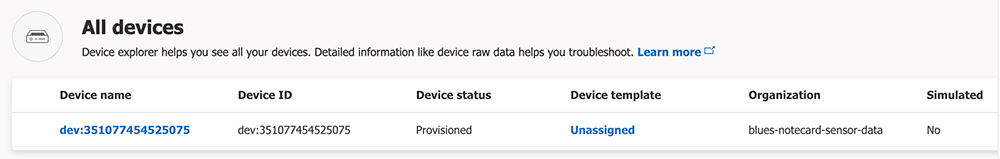
Click on the Devices item in the left navigation. You should see your Notecard as an Unassigned device under the All devices view.
-
Select your device and click the Migrate menu item above the device list.
-
In the modal window, click the Blues Notecard device template and click Migrate.
Your Notecard is now fully connected to your IoT Central application! Now, let's create some dashboards to visualize sensor data.
To debug a route or inspect the exact request Notehub sends to your third-party service, open an event in Notehub, click Route as cURL, and choose the appropriate HTTP-based route. The modal shows a cURL command that reproduces the same request Notehub makes, with secrets (API keys, passwords, etc.) replaced by placeholders.

Build Data Visualizations
Once you've connected your Notecard to IoT Central, you'll want to confirm that the telemetry interfaces you set up are being captured correctly.
-
In your IoT Central application, click on the Devices menu item and open your device.
-
You'll be presented with the Raw data, or a list of events ingested into IoT Central. If you see values under the Humidity and Temperature columns, you're ready to create some visualizations!
 note
noteIf those sensor values are showing up in the Unmodeled data column, make sure that the field names in your Notehub Route match the telemetry names you configured in your IoT Central device template.
Create a Device Dashboard
Let's add a simple line chart to show historical readings, over time, on the default device dashboard provided.
-
Click on Dashboards, then click the Edit link on the dashboard.

-
In the Add a tile menu, click to Start with devices. Choose your device group and your device(s).

-
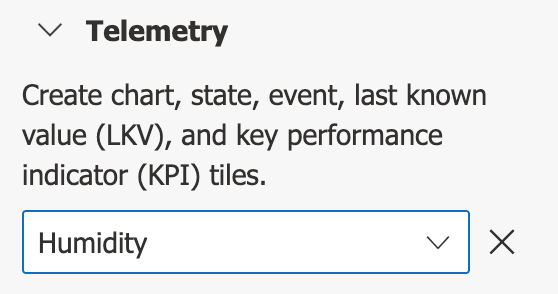
In the Telemetry section, select Humidity and then Temperature. Finally, click the Add tile button.

-
After adding the tile, a simple graph tile will appear on the far right of the dashboard. Note that you may need to edit the tile and choose a more appropriate Display range to see all of your sensor data.

-
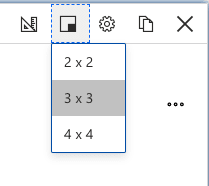
Click the box icon on the chart and select 3 x 3 to increase the chart size.
-
Click the pencil icon to edit the chart configuration. If you want, you can change the title and set custom colors for each sensor. When finished, click the Update button.

-
Click the Save button to save your dashboard. As readings come in from your Notecard, the graph will update automatically.

Show the Last Known Value in a Tile
A graph is useful for viewing data over time, but it's often helpful to also have a view of the last known sensor values. In this section, we'll add tiles to show the last known temperature and humidity values.
-
If not currently editing your dashboard, click the Edit button to enter edit mode. Just like before, in the Add a tile section, click Start with devices. Choose your device group and your device(s).
-
In the Telemetry section, select Humidity and click the Add tile button.
-
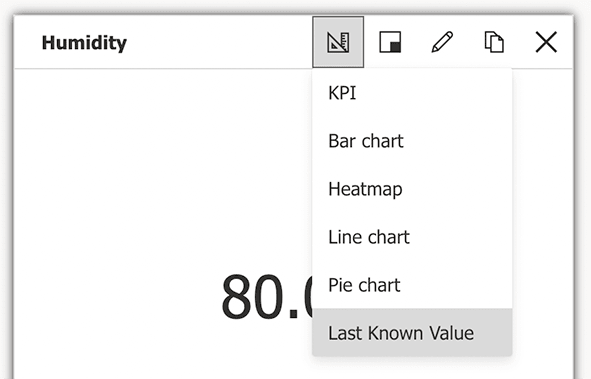
Change the tile type to Last Known Value by clicking on the ruler button.
-
Repeat this same process for the Temperature reading.
-
Click Save and revel in your data visualization skills!

Next Steps
Congratulations! You've created your first Route and connected your Notecard app to an external service. If you're following a Cell+WiFi Quickstart, you're done!
Now that you know the basics of how Notecard and Notehub work, you’re ready to apply what you’ve learned towards a real project. We have a few recommendations on what to do next:
-
Learn Best Practices for Production Projects: This skimmable guide has a list of best practices for moving your project from a prototype to a real, production-ready deployment.
-
Browse Example Apps: Our collection of IoT apps that show how to build common projects with Blues. These example apps include dozens of official Blues project accelerators and a collection of purpose-built sample apps.
-
Follow the Notehub Walkthrough: Learn how to manage projects and device fleets, update Notecard and host firmware, set up alerts, securely route your data, and more.
At any time, if you find yourself stuck, please reach out on the community forum.