Routing Data to Cloud: Ubidots
Watch a video of this tutorial
In previous tutorials you've learned about the Blues Notecard, and used it to collect data and send it to Notehub, the Blues cloud service.
One powerful feature of Notehub is routes, which allow you to forward your data from Notehub to a public cloud like AWS, Azure, or Google Cloud, to a data cloud like Snowflake, to dashboarding services like Datacake or Ubidots, or to a custom HTTP or MQTT-based endpoint. The tutorial below guides you through sending data to several popular services, and teaches you how to build visualizations using that data.
Don't see a cloud or backend that you need? Notehub is able to route data to virtually any provider. If you're having trouble setting up a route, reach out in our forum and we will help you out.
Introduction
This tutorial should take approximately 30-40 minutes to complete.
In this tutorial, you'll learn how to connect your Notecard-powered app to Ubidots, and learn how to start creating simple visualizations with sensor data.
This tutorial assumes you've already completed the initial
Sensor Tutorial to capture
sensor data, saved it in a Notefile called
sensors.qo, and sent that data through the Notecard to Notehub (or that
you've already created your own app with sensor data and are ready to connect
your app to external services).
Create a Route
A Route is an external API, or server location, where Notes can be forwarded upon receipt.
Routes are defined in Notehub for a Project and can target Notes from one or more Fleets or all Devices. A Project can have multiple routes defined and active at any one time.
Before you create a Route, ensure the data you want to route is available in Notehub by navigating to the Events view:

We'll start with a simple route that will pass Notecard events through to webhook.site, where you can view the full payload sent by Notehub. Using this service is a useful way to debug routes, add a simple health-check endpoint to your app, and familiarize yourself with Notehub's Routing capabilities.
-
Navigate to webhook.site. When the page loads, you'll be presented with a unique URL that you can use as a Route destination. Copy that URL for the next step.

-
Navigate to the Notehub.io project for which you want to create a route and click on the Routes menu item in the left nav.
-
Click Create Route.

-
Select the General HTTP/HTTPS Request/Response route type.

-
Give the route a name (for example, "Health").

-
For the Route URL, use the unique URL you obtained from webhook.site.

-
In the Filters section, choose Selected Notefiles and check the box(es) next to the Notefile(s) you want to route. For example, we used
sensors.qofor the sensor tutorial.
-
Make sure the Enabled switch at the top remains selected, and click Create Route.
-
Only Notes received after the Route is created are routed automatically. If new Notes have been received since you created the Route, proceed to the next step.
Alternatively, you can manually route existing Notes by (1) checking the box next to an event, (2) clicking the Route button, and (3) choosing the Route you would like to use:

-
Return to webhook.site. This page will update automatically with data sent from Notehub. The data from your sensor is contained within the
bodyattribute. Notice that Notehub provides you with a lot of information, by default. In the next section, we'll look at using transformations to customize what Notehub sends in a Route.
Use JSONata to Transform JSON
Before moving on to routing data to an external service, let's briefly explore using JSONata expressions to transform the data Notehub routes.
As mentioned above, Notehub provides a lot of information in each Route request. You may want to trim down what you send to the external service, or you might need to transform the payload to adhere to a format expected by that service. Either way, Notehub supports shaping the data sent to a Route using JSONata.
To learn more about JSONata later, have a look at the Blues JSONata Guide.
Transform Your Data
Let's try a simple query to the webhook.site Route created in the last section.
-
Navigate to the Routes page in Notehub and click on the Route you wish to edit.

-
In the Transform Data drop-down, select JSONata Expression.

-
In the JSONata Expression text area, add the following query to select the
tempandhumidityfrom thebody, create alocationfield that concatenates thetower_locationandtower_countryfields, and create atimefield.{ "temp": body.temp, "humidity": body.humidity, "location": tower_location & ', ' & tower_country, "time": when } -
Click Apply changes. Then, navigate back to webhook.site. As requests come in, you'll see your custom, JSONata-transformed payload in the Raw Content section.

 note
noteThe
tower_locationandtower_countryfields are only populated for events sent over cellular. For Starnote/satellite, LoRa or WiFi devices, those fields will be empty. If you want a single expression that works across connectivity types, use thebest_locationandbest_countryfields instead — Notehub appends those to every event, choosing the most accurate source available (GPS/GNSS, triangulation, or cell tower). See Data Notehub Appends to Events to learn more.
JSONata is simple, powerful, and flexible, and will come in handy as you create Routes for your external services. To explore JSONata further, visit our Blues JSONata Guide.
Route to an External Service
Now that you've created your first Route and learned how to use JSONata to shape the data sent by a Route, you can connect Notehub to an external service.
For this tutorial, you'll connect your app to Ubidots, which provides data collection, analysis, and visualization tooling for connected IoT projects.
Create an Ubidots Account
If you don't have one already, you'll first want to create a free 30-day Ubidots trial account.
Create a Device to Store Sensor Data
In Ubidots-speak, a device represents a data source that stores your sensor data in variables (which are sets of data points stored within a given Ubidots device).
-
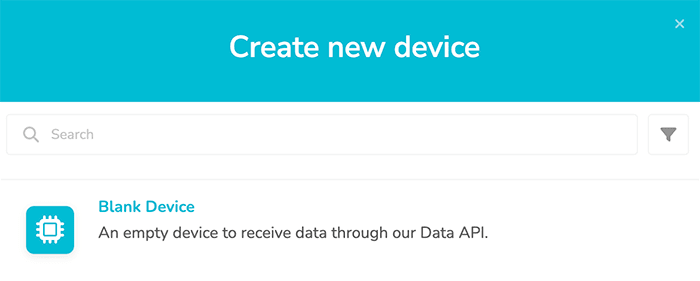
Once you've created your account, navigate to the Devices dashboard and add a new Blank Device.
-
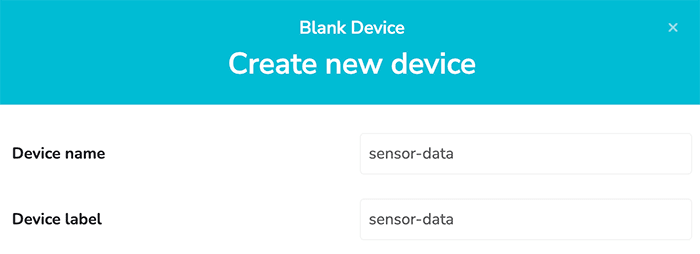
Enter a name and an API label for the device. Please note that API labels for both devices and variables are case-sensitive. Notehub will not preserve casing in the Route URL though, so we recommend using lowercase strings for your labels.
Create a Route in Notehub
-
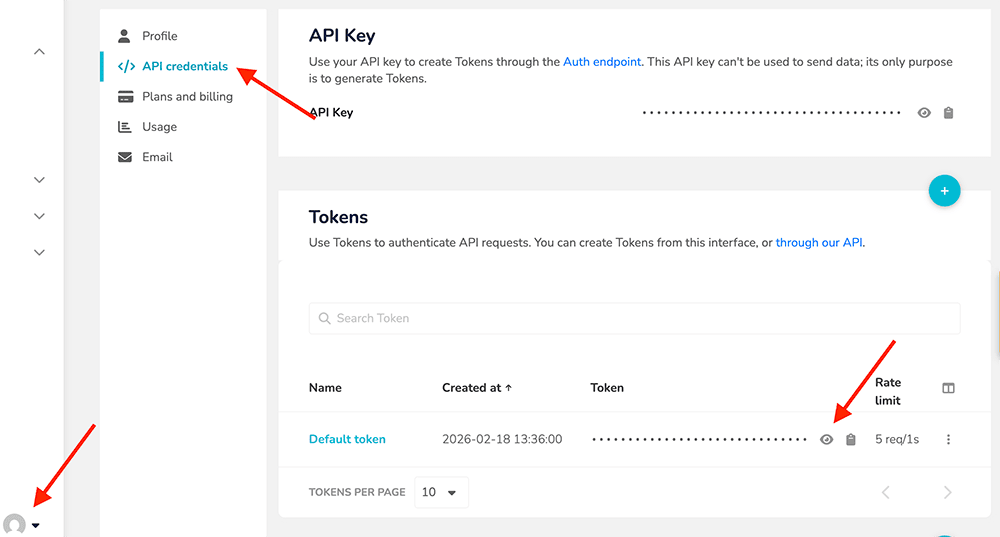
To send data to your Ubidots device and variable, you'll need your default token. Click on your profile and choose API credentials. Copy your default token for the next steps.
-
Back in Notehub, open the Routes dashboard and click the Create Route button.
-
Select the General HTTP/HTTPS Request/Response route type.
-
Give the route a name, and for the URL, enter
https://industrial.api.ubidots.com/api/v1.6/devices/[device-name]/, substituting in the device name you created earlier (without brackets) — for example,https://industrial.api.ubidots.com/api/v1.6/devices/sensor-data/ -
For HTTP Headers choose to add Additional Headers. Add a header with a name of
X-Auth-Tokenand a value of the default token you copied earlier.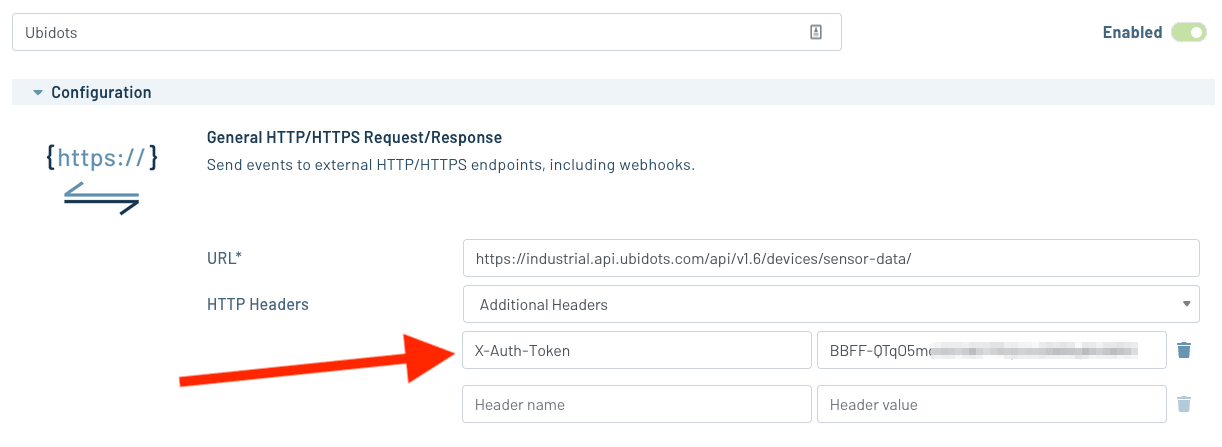
-
In the Notefiles dropdown, choose Selected Notefiles and check
sensors.qo. Then, in the Transform Data section, selectJSONata Expressionand enter the following expression:{ "temperature": {"value": body.temp, "timestamp": when * 1000} } -
Click Create Route and navigate back to your Ubidots device. If everything is wired up correctly, the default data visualization will update as new
sensors.qoNotes with temperature readings are sent to Notehub from your device.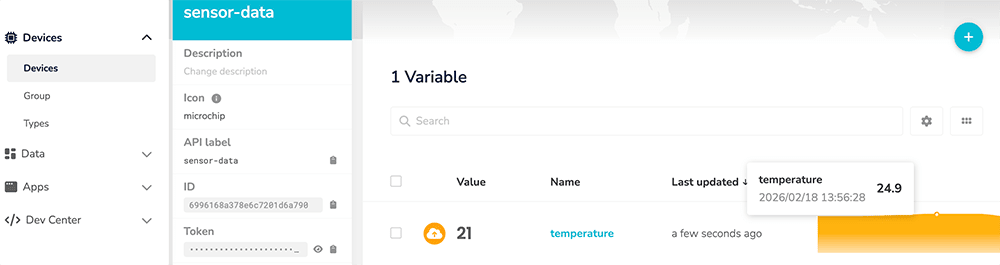 note
noteRemember, if you don't have any new Notes coming in to Notehub, you can always manually route existing Notes by (1) checking the box next to an event, (2) clicking the Route button, and (3) choosing the Route you would like to use.
To debug a route or inspect the exact request Notehub sends to your third-party service, open an event in Notehub, click Route as cURL, and choose the appropriate HTTP-based route. The modal shows a cURL command that reproduces the same request Notehub makes, with secrets (API keys, passwords, etc.) replaced by placeholders.

Build Data Visualizations
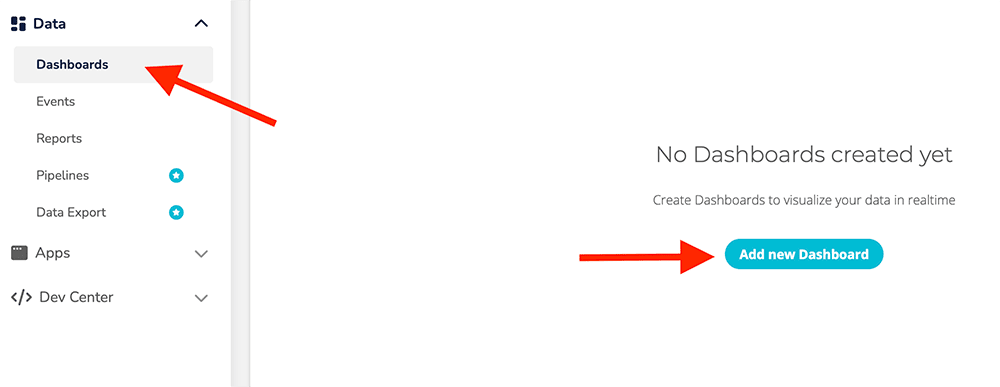
The visualization provided by Ubidots is great for a quick read of a single data point. However, you can also add additional visualizations by creating an Ubidots dashboard.
-
Navigate to Data > Dashboards and click the Add new Dashboard button. Provide a name for your dashboard and save your changes.
-
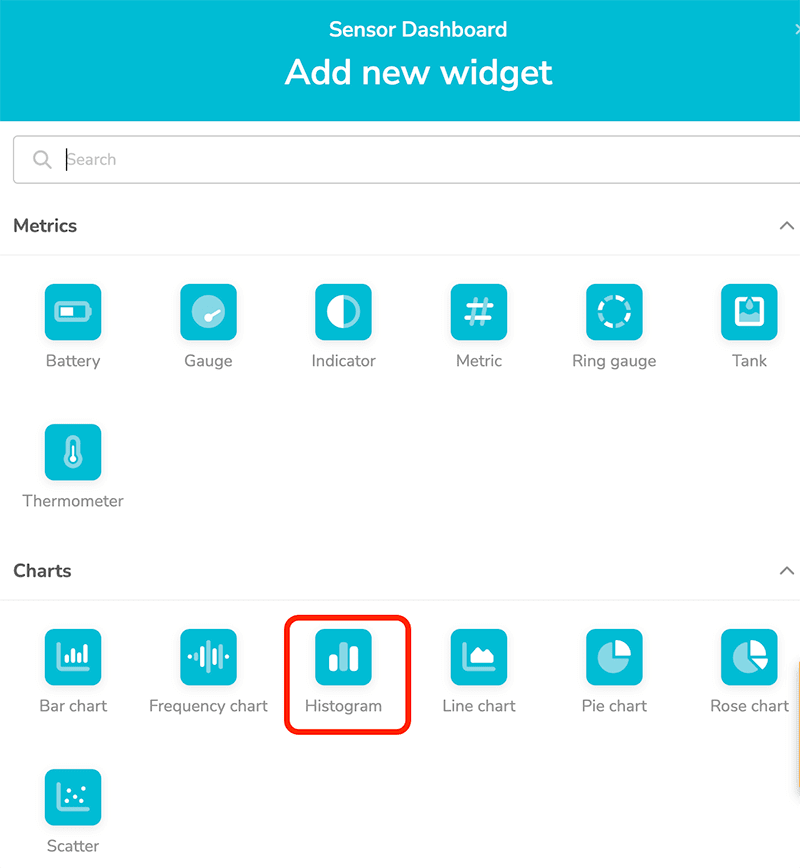
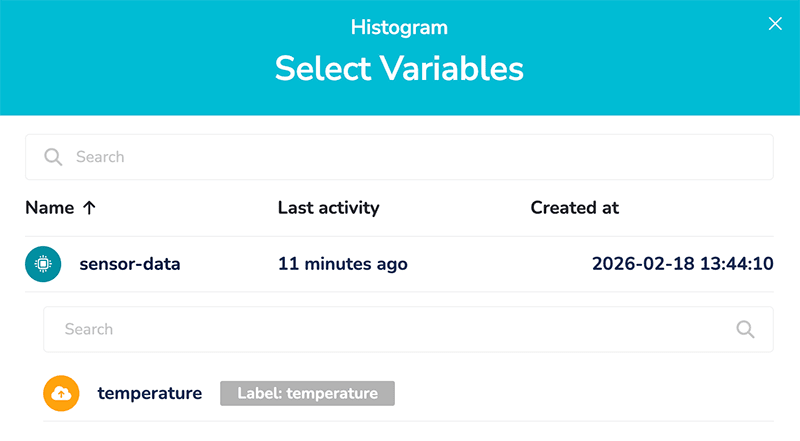
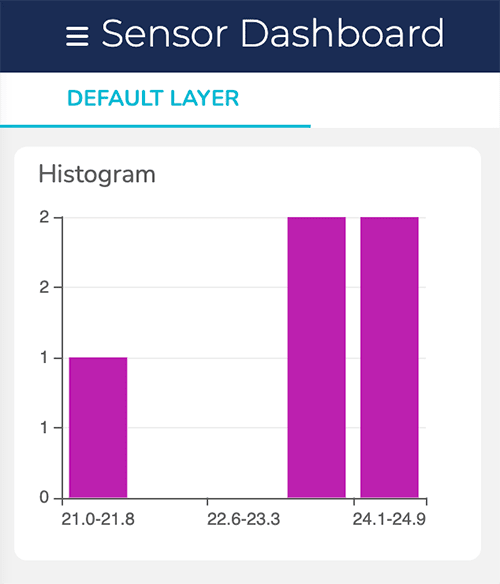
Click the Add new Widget button and choose Histogram. This widget will group your temperature data in a bar chart display so you can see which temperature ranges are most often recorded.
-
In the histogram configuration screen, click on Add Variables and choose the Ubidots variable you'd like to display.
-
Save all of the changes you've made and enjoy your first, albeit very basic, Ubidots data visualization!
-
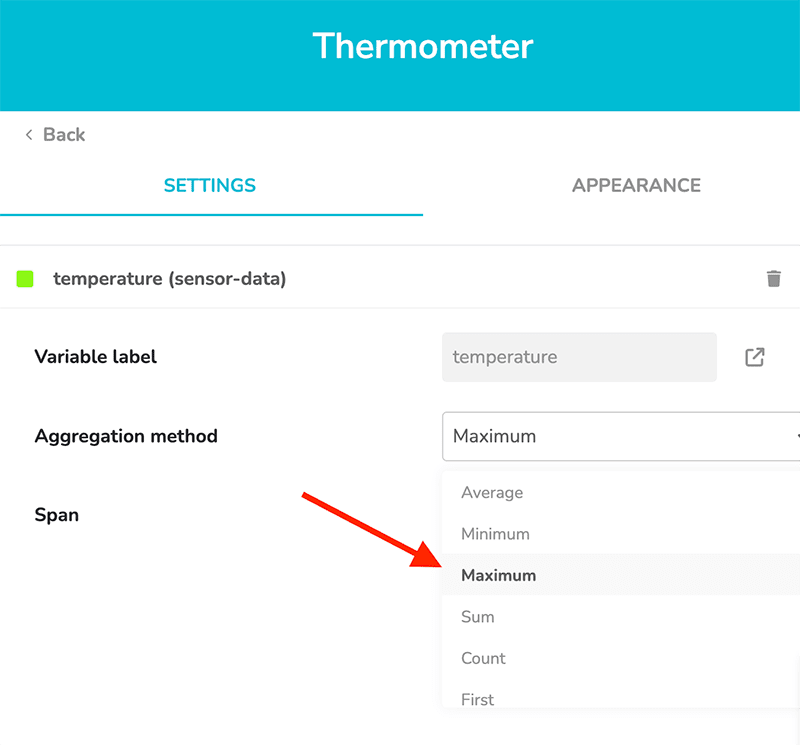
Let's add one more data visualization to this dashboard. Click the + icon in the upper-right corner to Add new widget. This time add a Thermometer.
-
Select the Ubidots variable as you did earlier, but this time before saving, look at the Aggregation method dropdown and choose which value you'd like to display (e.g. "Maximum").
-
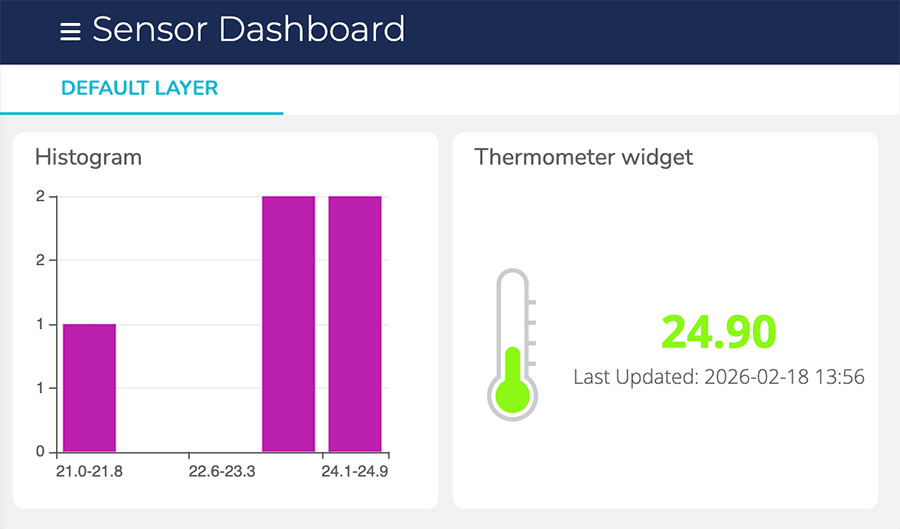
Save your changes and enjoy your expanded Ubidots data visualization dashboard!
Next Steps
Congratulations! You've created your first Route and connected your Notecard app to an external service. If you're following a Cell+WiFi Quickstart, you're done!
Now that you know the basics of how Notecard and Notehub work, you’re ready to apply what you’ve learned towards a real project. We have a few recommendations on what to do next:
-
Learn Best Practices for Production Projects: This skimmable guide has a list of best practices for moving your project from a prototype to a real, production-ready deployment.
-
Browse Example Apps: Our collection of IoT apps that show how to build common projects with Blues. These example apps include dozens of official Blues project accelerators and a collection of purpose-built sample apps.
-
Follow the Notehub Walkthrough: Learn how to manage projects and device fleets, update Notecard and host firmware, set up alerts, securely route your data, and more.
At any time, if you find yourself stuck, please reach out on the community forum.