Routing Data to Cloud: AWS
Watch a video of this tutorial
In previous tutorials you've learned about the Blues Notecard, and used it to collect data and send it to Notehub, the Blues cloud service.
One powerful feature of Notehub is routes, which allow you to forward your data from Notehub to a public cloud like AWS, Azure, or Google Cloud, to a data cloud like Snowflake, to dashboarding services like Datacake or Ubidots, or to a custom HTTP or MQTT-based endpoint. The tutorial below guides you through sending data to several popular services, and teaches you how to build visualizations using that data.
Don't see a cloud or backend that you need? Notehub is able to route data to virtually any provider. If you're having trouble setting up a route, reach out in our forum and we will help you out.
Introduction
This tutorial should take approximately 30-40 minutes to complete.
In this tutorial, you'll learn how to connect your Notecard-powered app to AWS, and learn how to start creating simple visualizations with sensor data.
This tutorial assumes you've already completed the initial
Sensor Tutorial to capture
sensor data, saved it in a Notefile called
sensors.qo, and sent that data through the Notecard to Notehub (or that
you've already created your own app with sensor data and are ready to connect
your app to external services).
Create a Route
A Route is an external API, or server location, where Notes can be forwarded upon receipt.
Routes are defined in Notehub for a Project and can target Notes from one or more Fleets or all Devices. A Project can have multiple routes defined and active at any one time.
Before you create a Route, ensure the data you want to route is available in Notehub by navigating to the Events view:

We'll start with a simple route that will pass Notecard events through to webhook.site, where you can view the full payload sent by Notehub. Using this service is a useful way to debug routes, add a simple health-check endpoint to your app, and familiarize yourself with Notehub's Routing capabilities.
-
Navigate to webhook.site. When the page loads, you'll be presented with a unique URL that you can use as a Route destination. Copy that URL for the next step.

-
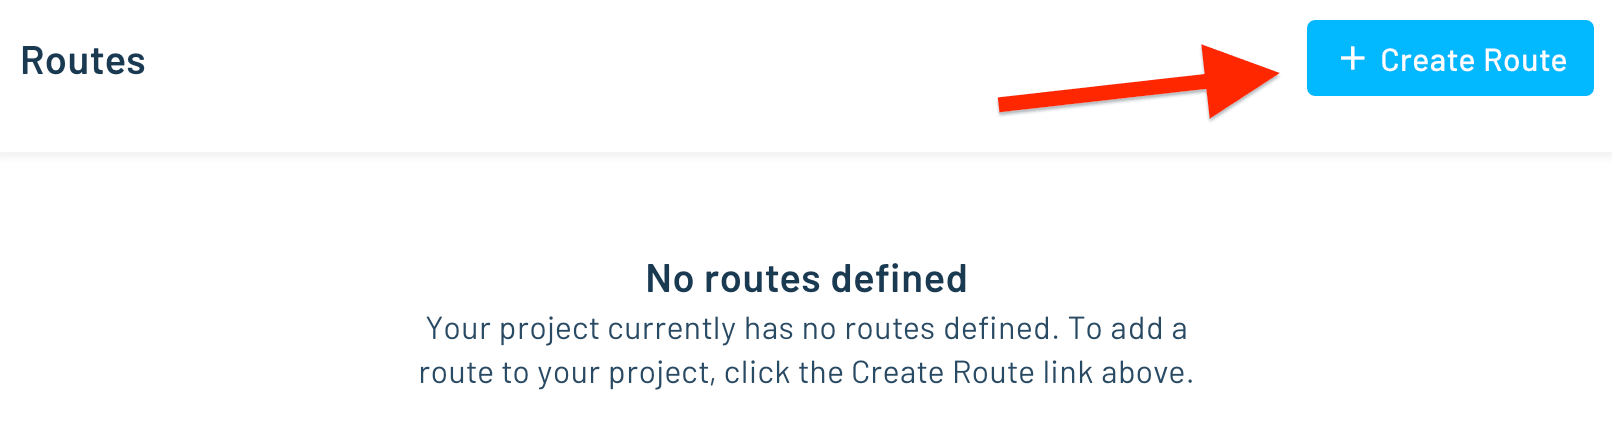
Navigate to the Notehub.io project for which you want to create a route and click on the Routes menu item in the left nav.
-
Click Create Route.

-
Select the General HTTP/HTTPS Request/Response route type.

-
Give the route a name (for example, "Health").

-
For the Route URL, use the unique URL you obtained from webhook.site.

-
In the Filters section, choose Selected Notefiles and check the box(es) next to the Notefile(s) you want to route. For example, we used
sensors.qofor the sensor tutorial.
-
Make sure the Enabled switch at the top remains selected, and click Create Route.
-
Only Notes received after the Route is created are routed automatically. If new Notes have been received since you created the Route, proceed to the next step.
Alternatively, you can manually route existing Notes by (1) checking the box next to an event, (2) clicking the Route button, and (3) choosing the Route you would like to use:

-
Return to webhook.site. This page will update automatically with data sent from Notehub. The data from your sensor is contained within the
bodyattribute. Notice that Notehub provides you with a lot of information, by default. In the next section, we'll look at using transformations to customize what Notehub sends in a Route.
Use JSONata to Transform JSON
Before moving on to routing data to an external service, let's briefly explore using JSONata expressions to transform the data Notehub routes.
As mentioned above, Notehub provides a lot of information in each Route request. You may want to trim down what you send to the external service, or you might need to transform the payload to adhere to a format expected by that service. Either way, Notehub supports shaping the data sent to a Route using JSONata.
To learn more about JSONata later, have a look at the Blues JSONata Guide.
Transform Your Data
Let's try a simple query to the webhook.site Route created in the last section.
-
Navigate to the Routes page in Notehub and click on the Route you wish to edit.

-
In the Transform Data drop-down, select JSONata Expression.

-
In the JSONata Expression text area, add the following query to select the
tempandhumidityfrom thebody, create alocationfield that concatenates thetower_locationandtower_countryfields, and create atimefield.{ "temp": body.temp, "humidity": body.humidity, "location": tower_location & ', ' & tower_country, "time": when } -
Click Apply changes. Then, navigate back to webhook.site. As requests come in, you'll see your custom, JSONata-transformed payload in the Raw Content section.

 note
noteThe
tower_locationandtower_countryfields are only populated for events sent over cellular. For Starnote/satellite, LoRa or WiFi devices, those fields will be empty. If you want a single expression that works across connectivity types, use thebest_locationandbest_countryfields instead — Notehub appends those to every event, choosing the most accurate source available (GPS/GNSS, triangulation, or cell tower). See Data Notehub Appends to Events to learn more.
JSONata is simple, powerful, and flexible, and will come in handy as you create Routes for your external services. To explore JSONata further, visit our Blues JSONata Guide.
Route to an External Service
Now that you've created your first Route and learned how to use JSONata to shape the data sent by a Route, you can connect Notehub to an external service.
In this section of the tutorial, you'll connect your app to AWS (Amazon Web Services). AWS is a comprehensive cloud computing platform that provides on-demand infrastructure, storage, machine learning, and developer tools to build, deploy, and scale applications globally.
Given the wide range of tools and services in the AWS ecosystem, there are many ways to route and visualize data. This tutorial takes a relatively straightforward approach:
- Route events from Notehub to an AWS Lambda function.
- Use the Lambda function to store events in an S3 bucket.
- Use QuickSight to visualize the events stored in S3.
Create an AWS Account
If you don't have one already, create an AWS account. Then, log in to your AWS Management Console.
Create an S3 Bucket
The first step is to create a repository (an S3 bucket) where you'll store JSON files (events) routed from Notehub.
-
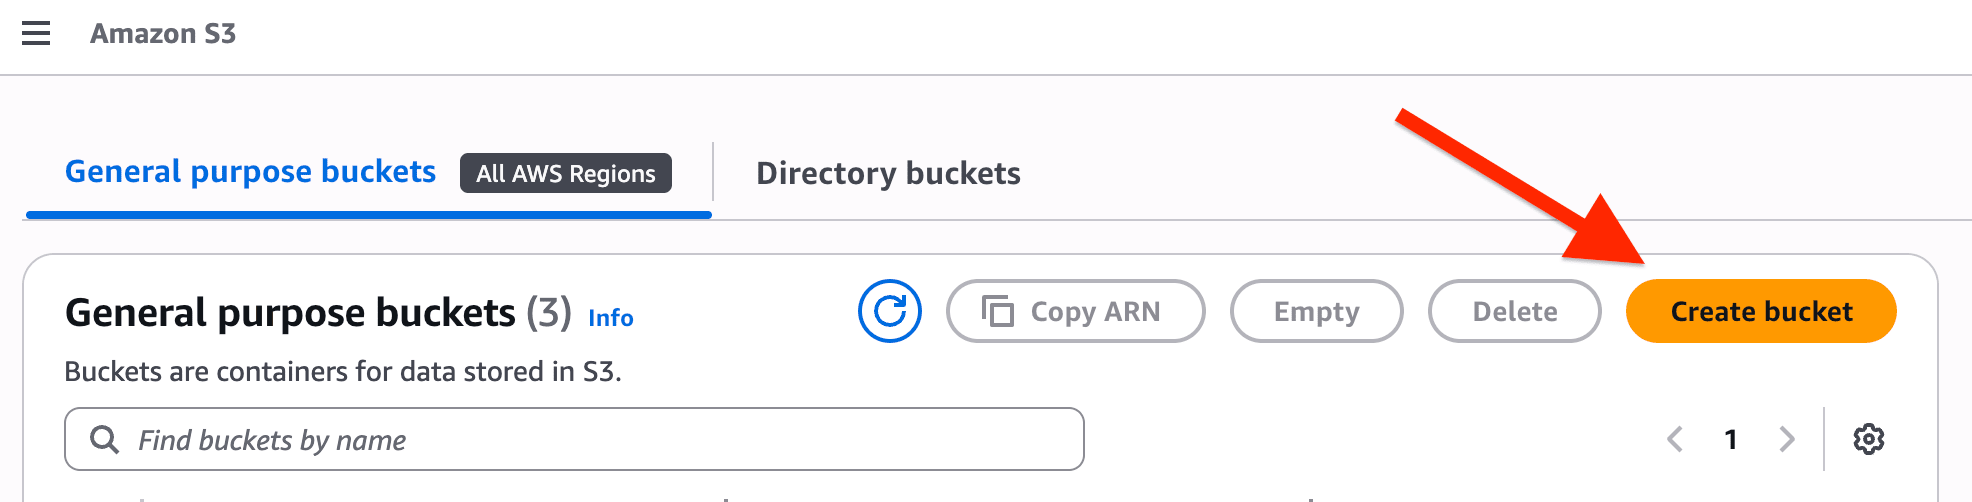
Navigate to the Amazon S3 section of the AWS Management Console and click the Create bucket button.
-
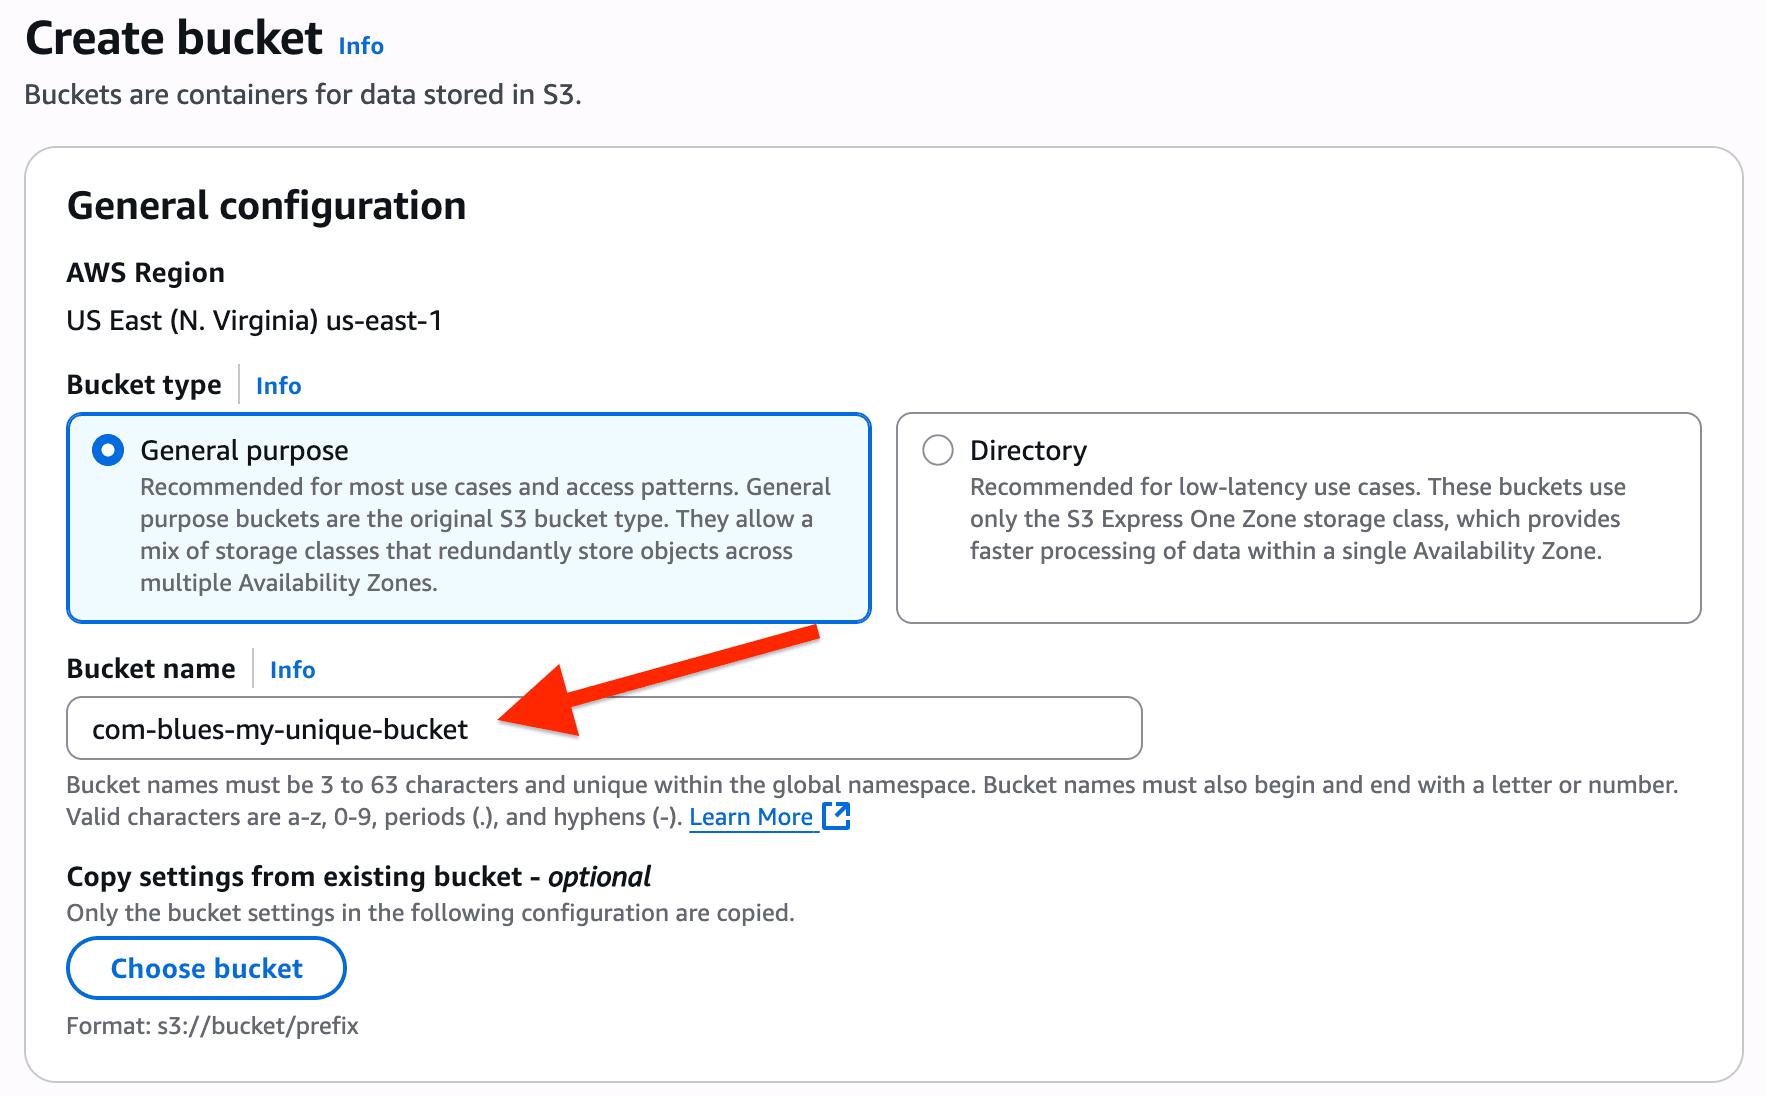
Leave the default selection of "general purpose" bucket type and provide a globally-unique name for the bucket.
-
When done configuring your S3 bucket, click the Create bucket button.
Create a Lambda Function
With your S3 bucket created and configured, it's time to write an AWS Lambda function that will receive events POSTed from Notehub and store them in S3.
-
Navigate to the Lambda section of the AWS Management Console and click on the Create function button.
-
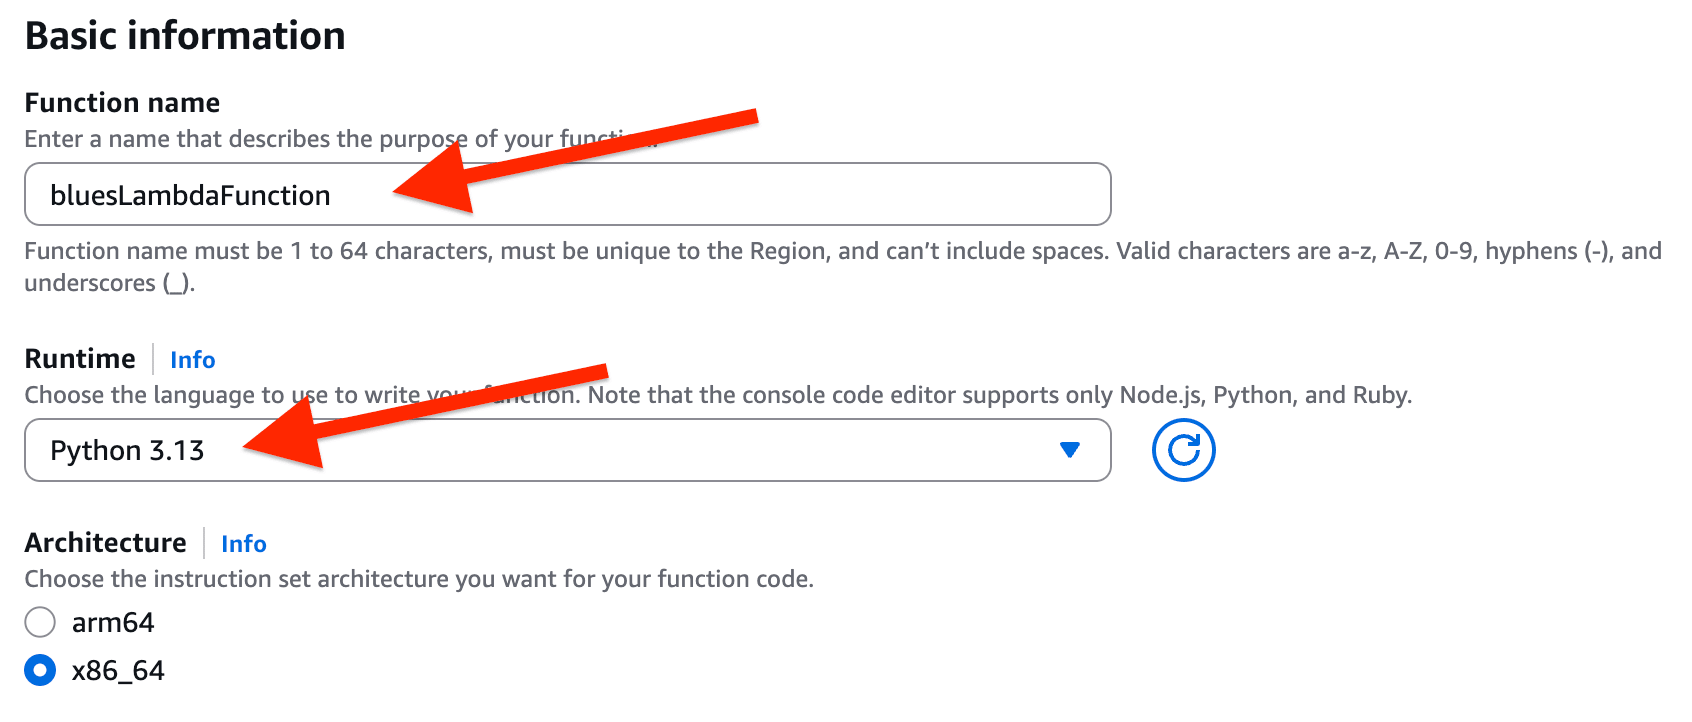
Provide a function name and choose the appropriate runtime. This tutorial provides code for a Lambda function written in Python, but there are other runtime options available.
-
Under Additional Configurations, check to enable the creation of a unique Function URL and (optionally) choose NONE as the Auth type.
noteA production-ready version of this Lambda would have you use AWS_IAM as the Auth type. That does require additional configuration in setting up IAM user(s) and role(s) and is outside the scope of this tutorial.

-
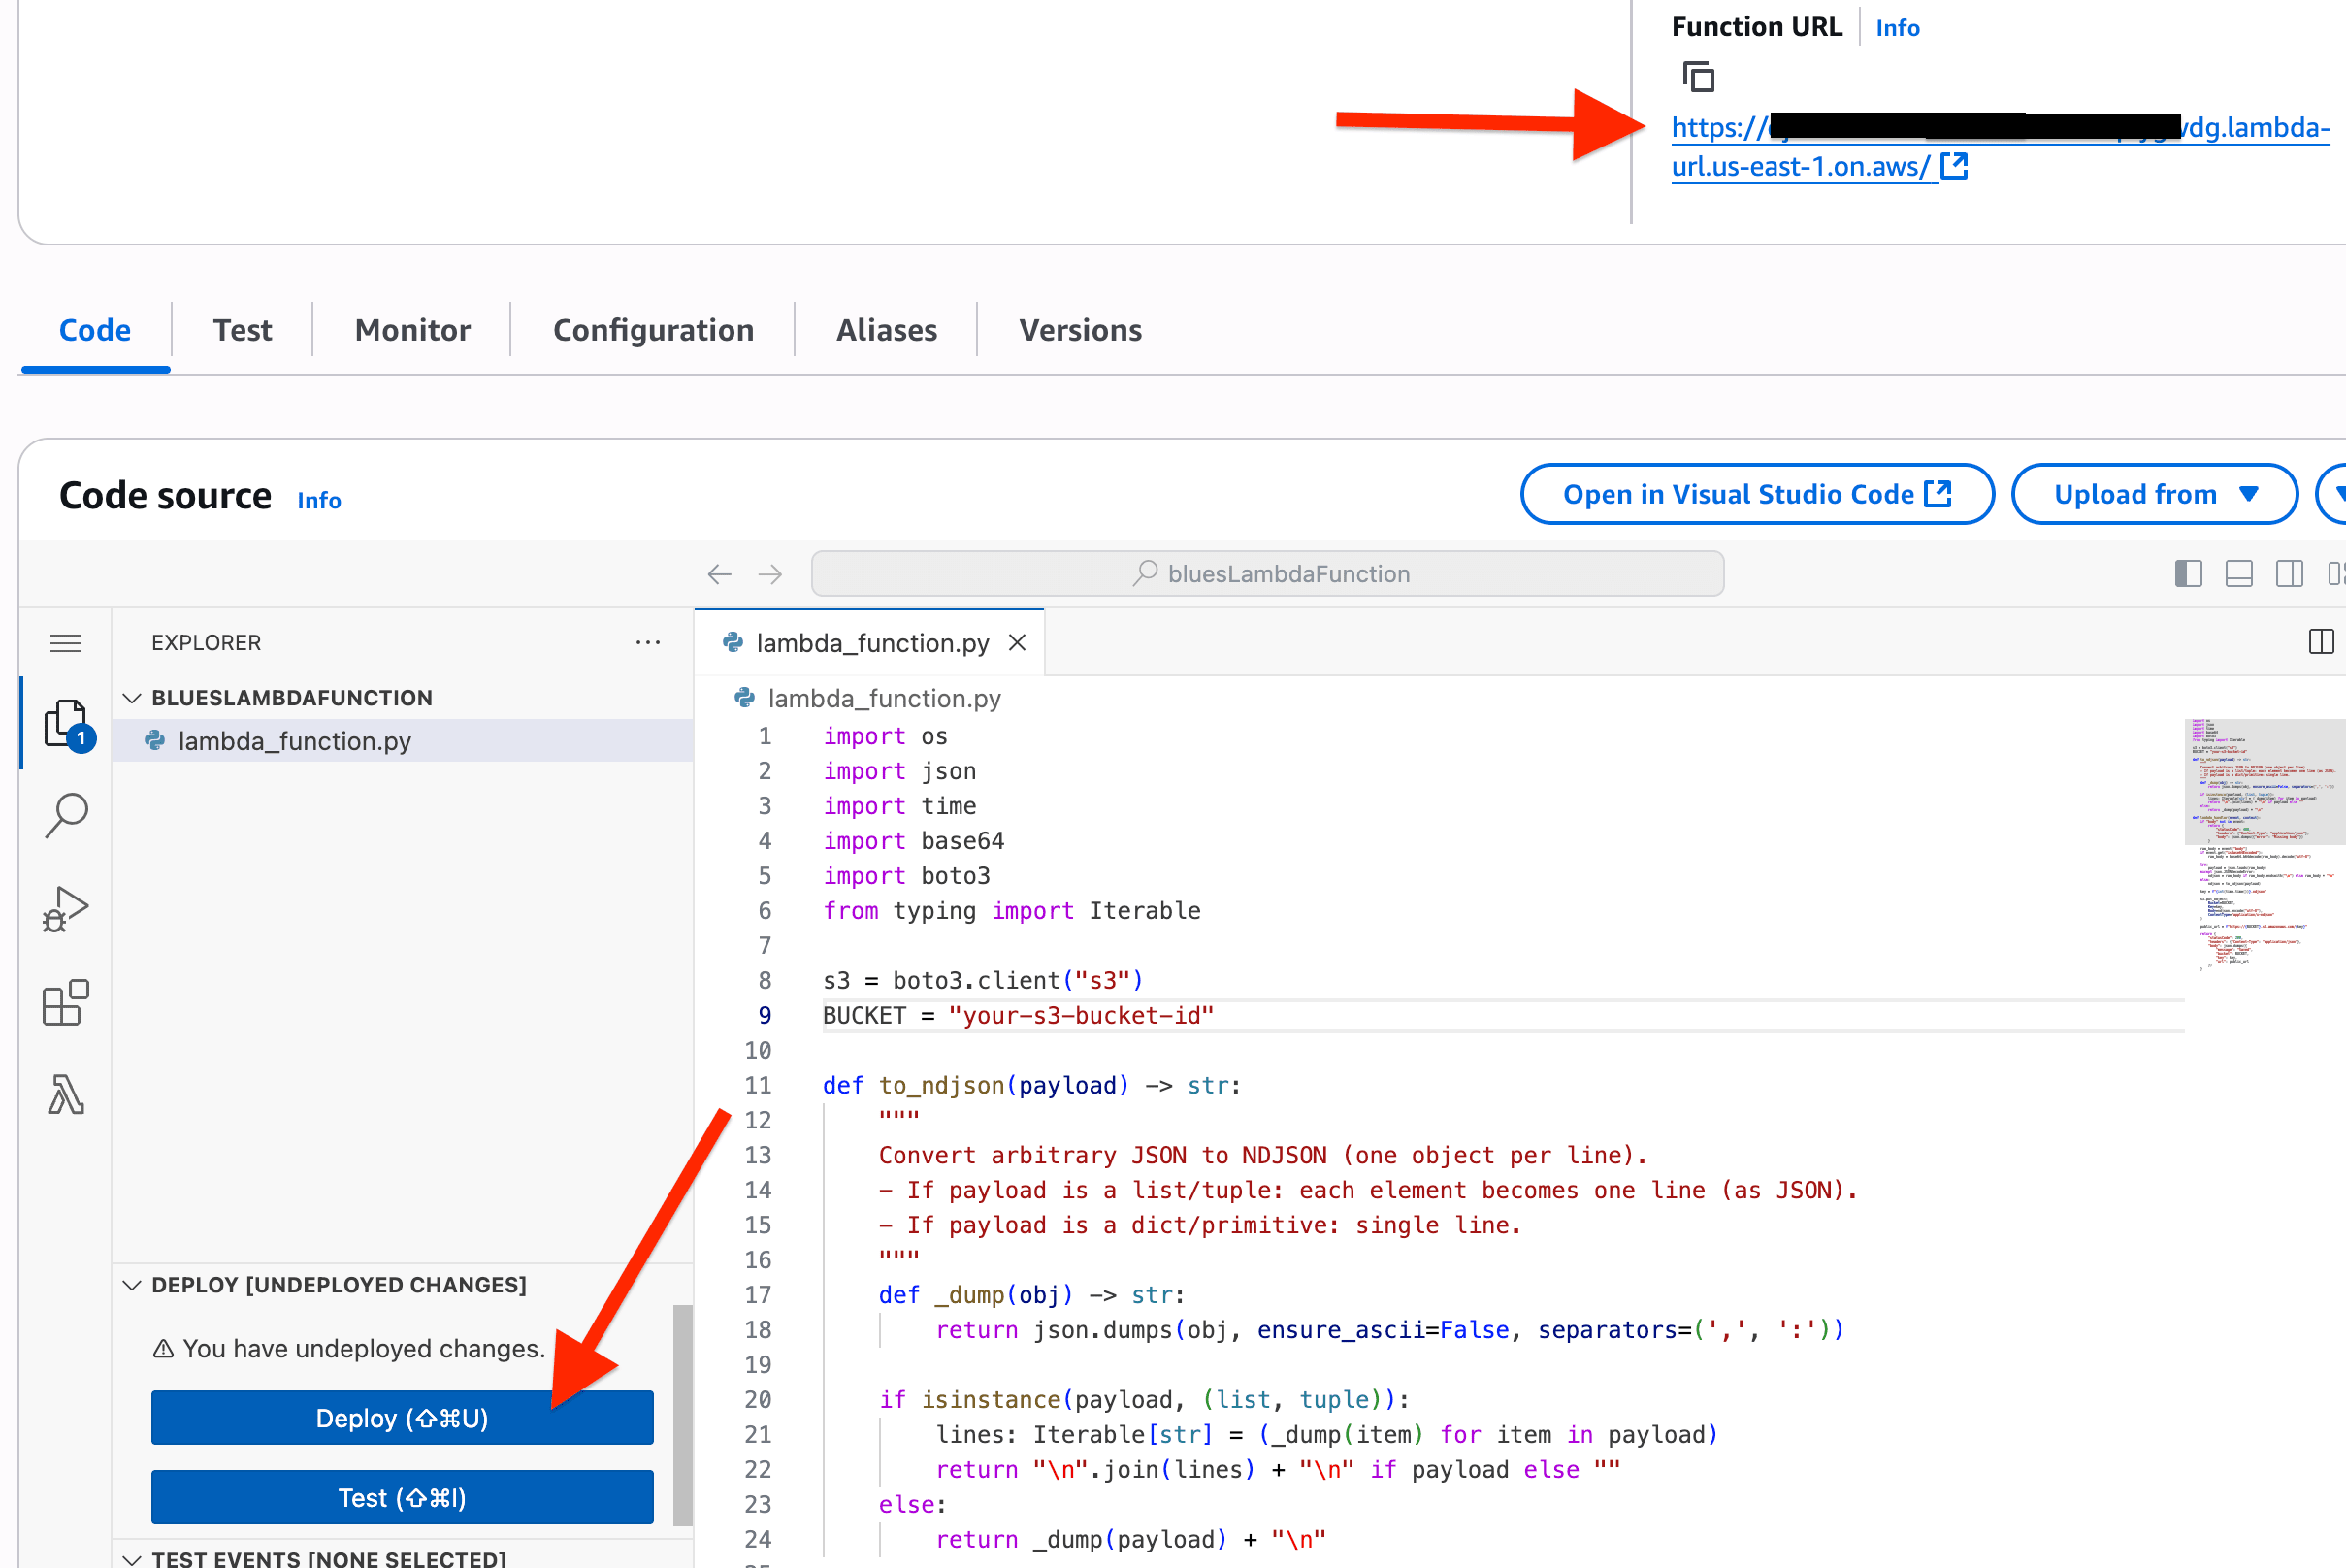
After the Lambda function is initialized, navigate to the Code tab and paste in the following Python code, replacing
your-s3-bucket-idwith your S3 bucket name.Please note that this Lambda also converts JSON to NDJSON (Newline Delimited JSON). This is useful if you choose to later use AWS Athena as a query service.
import os import json import time import base64 import boto3 from typing import Iterable s3 = boto3.client("s3") BUCKET = "your-s3-bucket-id" def to_ndjson(payload) -> str: def _dump(obj) -> str: return json.dumps(obj, ensure_ascii=False, separators=(',', ':')) if isinstance(payload, (list, tuple)): lines: Iterable[str] = (_dump(item) for item in payload) return "\n".join(lines) + "\n" if payload else "" else: return _dump(payload) + "\n" def lambda_handler(event, context): if "body" not in event: return { "statusCode": 400, "headers": {"Content-Type": "application/json"}, "body": json.dumps({"error": "Missing body"}) } raw_body = event["body"] if event.get("isBase64Encoded"): raw_body = base64.b64decode(raw_body).decode("utf-8") try: payload = json.loads(raw_body) except json.JSONDecodeError: ndjson = raw_body if raw_body.endswith("\n") else raw_body + "\n" else: ndjson = to_ndjson(payload) key = f"{int(time.time())}.ndjson" s3.put_object( Bucket=BUCKET, Key=key, Body=ndjson.encode("utf-8"), ContentType="application/x-ndjson" ) public_url = f"https://{BUCKET}.s3.amazonaws.com/{key}" return { "statusCode": 200, "headers": {"Content-Type": "application/json"}, "body": json.dumps({ "message": "Saved", "bucket": BUCKET, "key": key, "url": public_url }) } -
Next, click to Deploy the Lambda and copy the provided Function URL.
Configure IAM Role for Lambda
With the Lambda function deployed, you do have to perform one small
configuration edit to the default role created for this Lambda to allow it to
PUT objects in the S3 bucket.
-
Navigate to the IAM section of the AWS Management Console and edit the Role that was created when deploying the Lambda function. The name of the role likely begins with the name of the Lambda function itself (e.g.
bluesLambdaFunction-role-xxxxx). -
In the Permissions policies section, click on the name of the policy you would like to edit (there is likely only one listed).
-
Click the Edit button. In the provided Policy editor add the following JSON to the Statement array (being sure to replace
your-s3-bucket-idwith your S3 bucket name).{ "Sid": "PutNDJSONToBucket", "Effect": "Allow", "Action": [ "s3:PutObject", "s3:AbortMultipartUpload" ], "Resource": "arn:aws:s3:::your-s3-bucket-id/*" } -
Click the Next and Save changes buttons to save your changes.
Create a Route in Notehub
-
Back in Notehub, navigate to the Routes menu option and click the Create Route button.
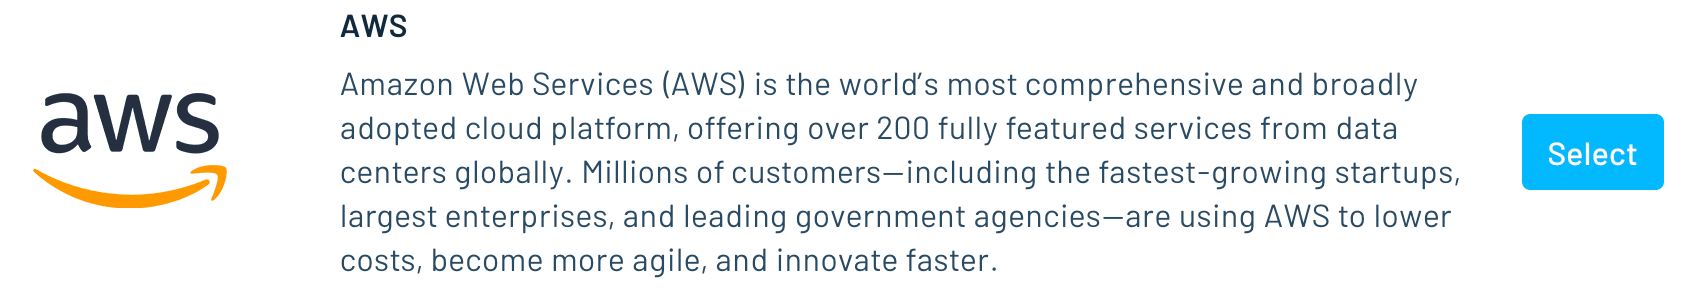
-
Scroll until you see the AWS route type and click the Select button.
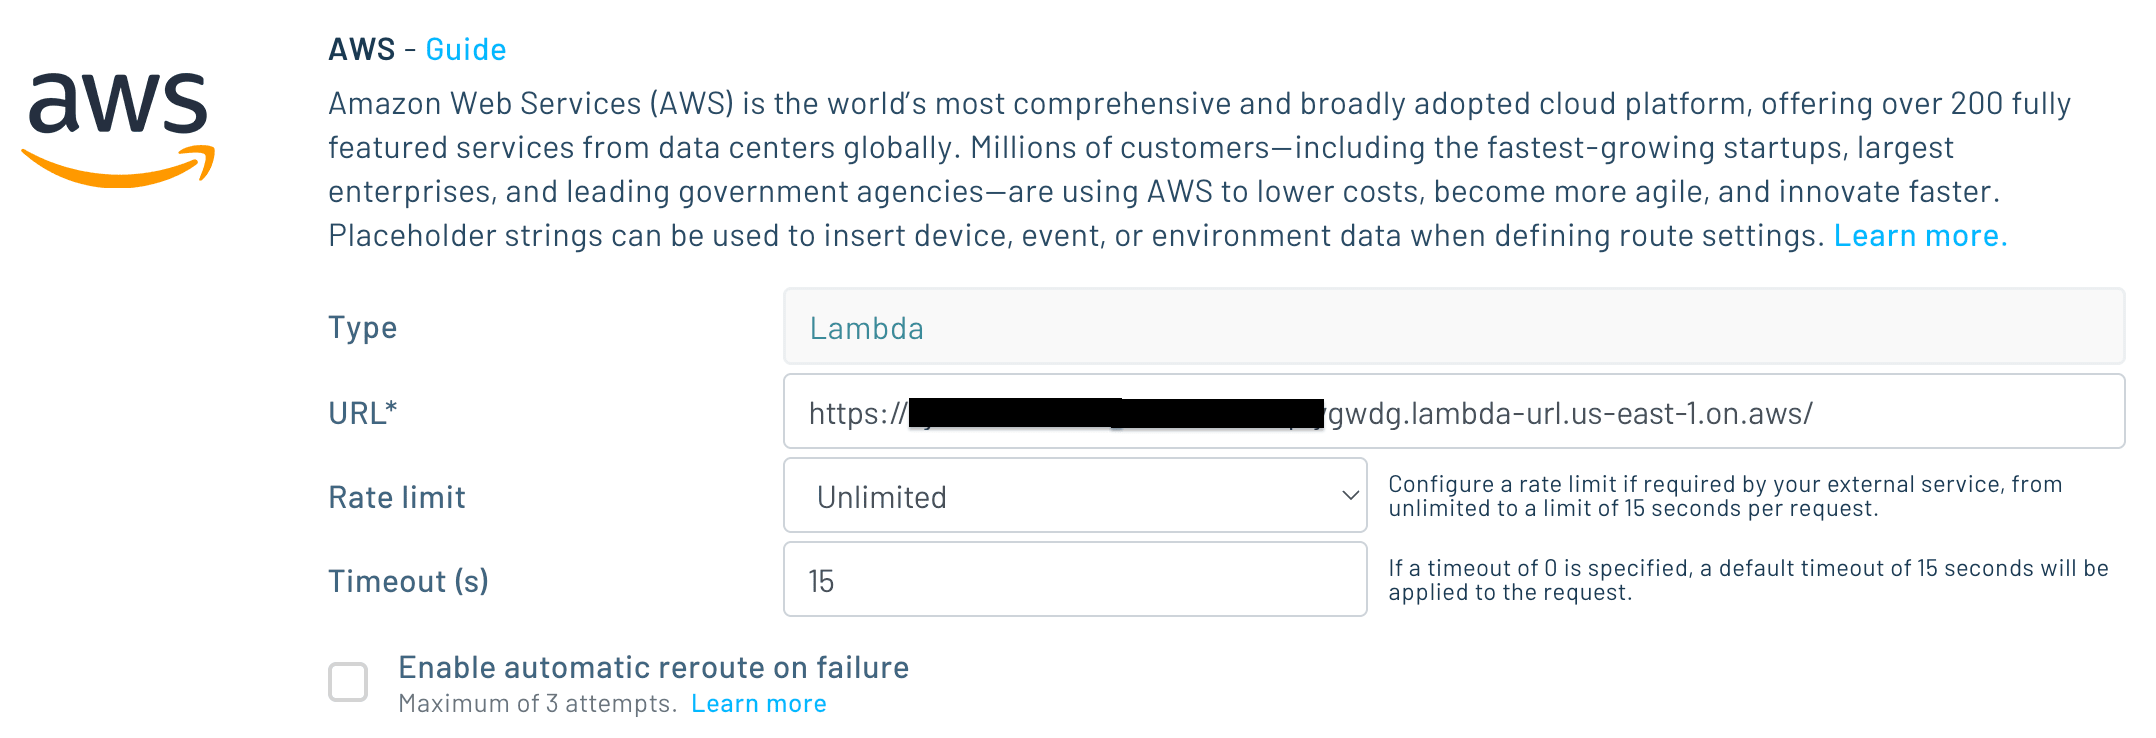
-
In the Configuration section, choose Lambda as the Type, and paste in the Lambda Function URL in the URL field.
-
Under the Filters section, choose to only sync the
sensors.qoNotefile. Under Data, choose JSONata Transform and paste in the following JSONata expression:{ "temp": body.temp, "humidity": body.humidity, "time": when }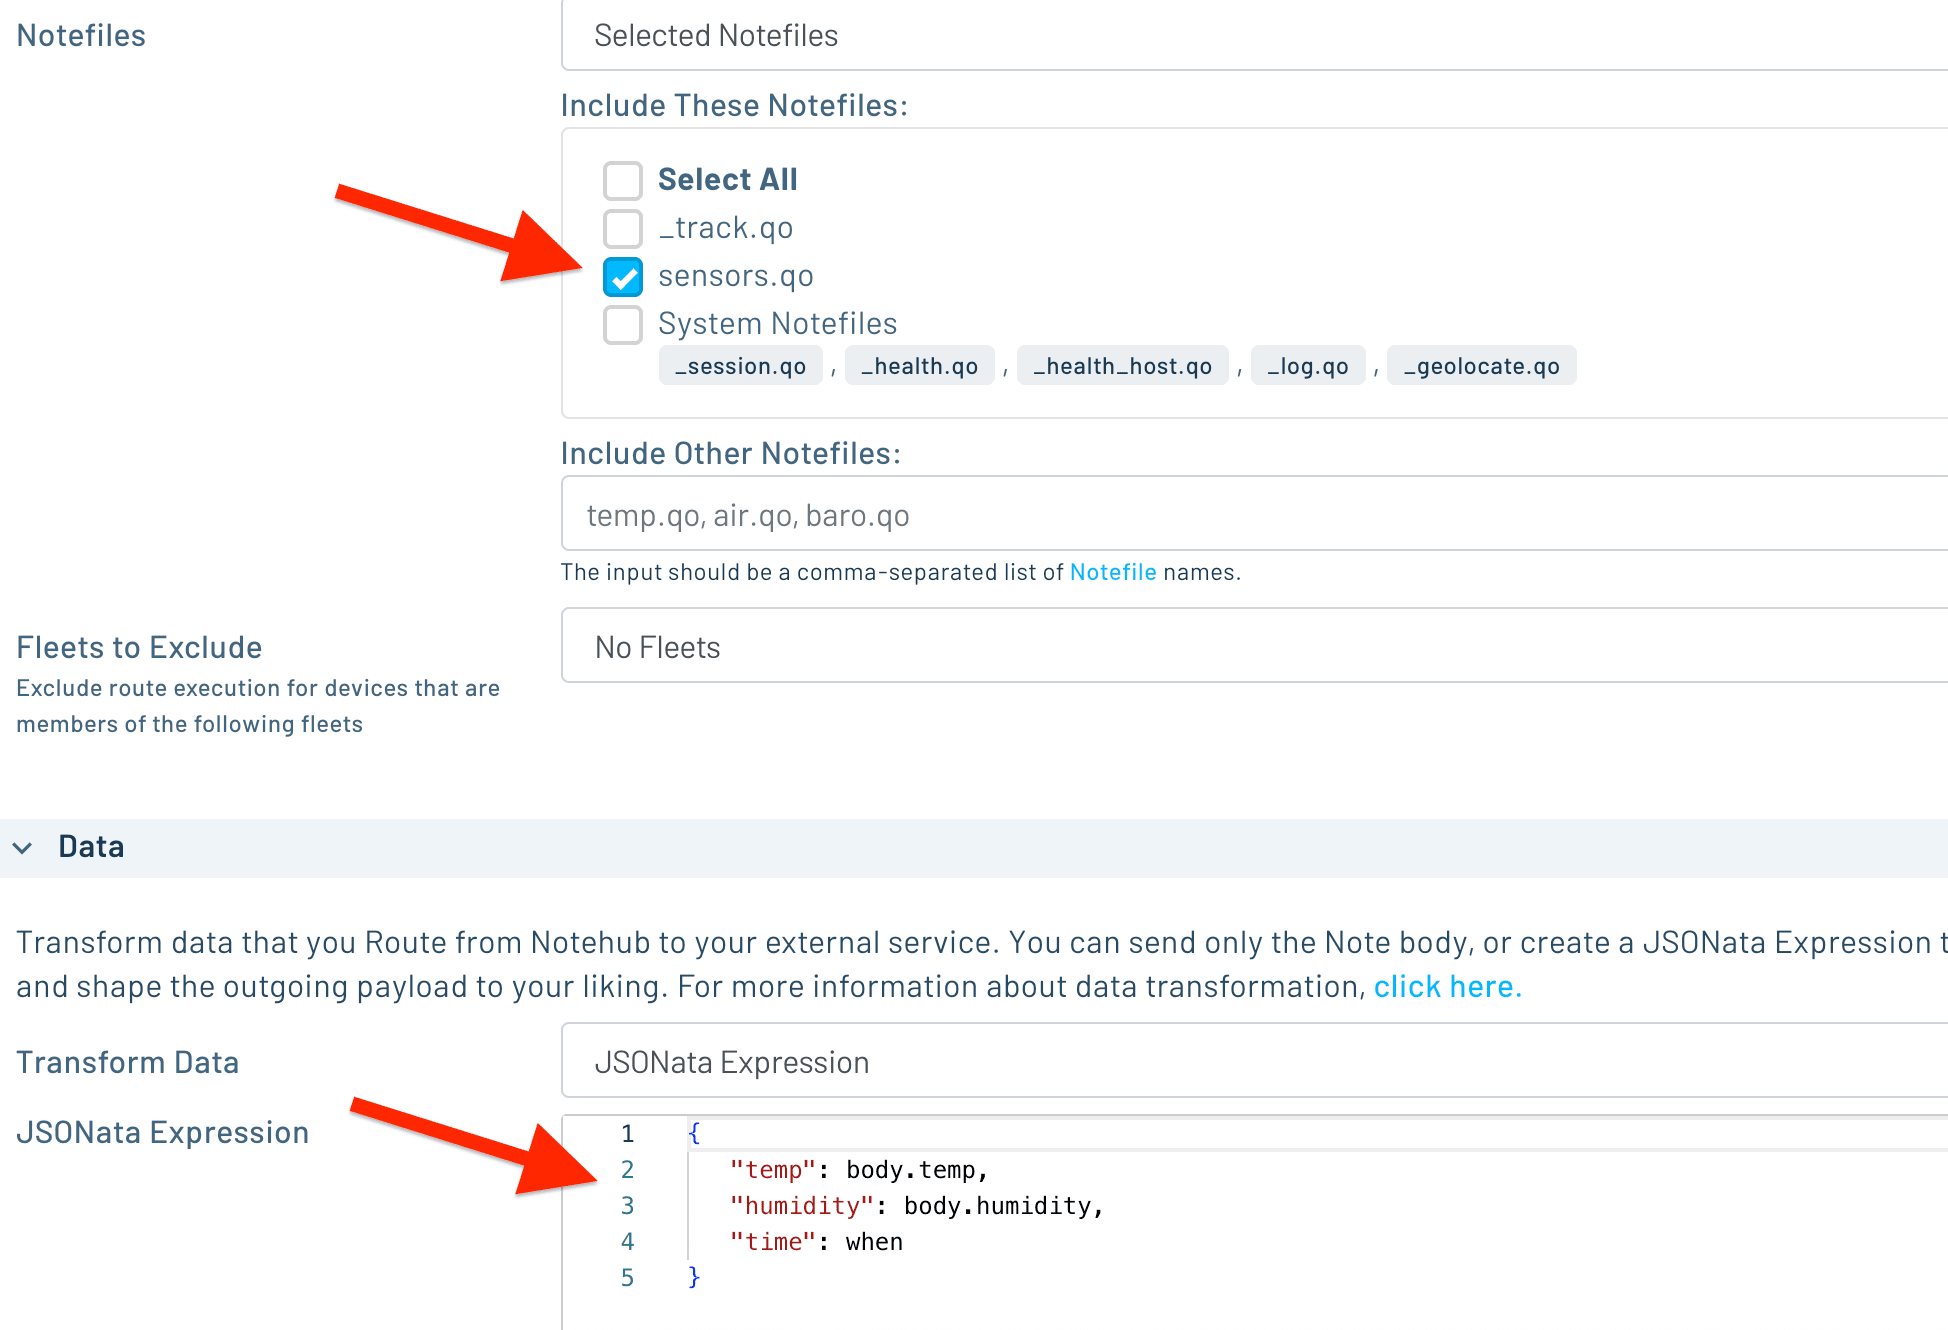
-
When you're done configuring your Notehub Route, click the Apply Changes button to save the Route.
Test the Route and View Data in S3
Before proceeding to creating visualizations based on this data, it's a good idea to test the Route and view the raw JSON saved in the S3 bucket.
Assuming sensor data is still being sent from your Notecard to Notehub in the
sensors.qo Notefile, you should see individual JSON (NDJSON) files created in
the S3 bucket. Each file is named with the UNIX Epoch timestamp when it was
created in S3.
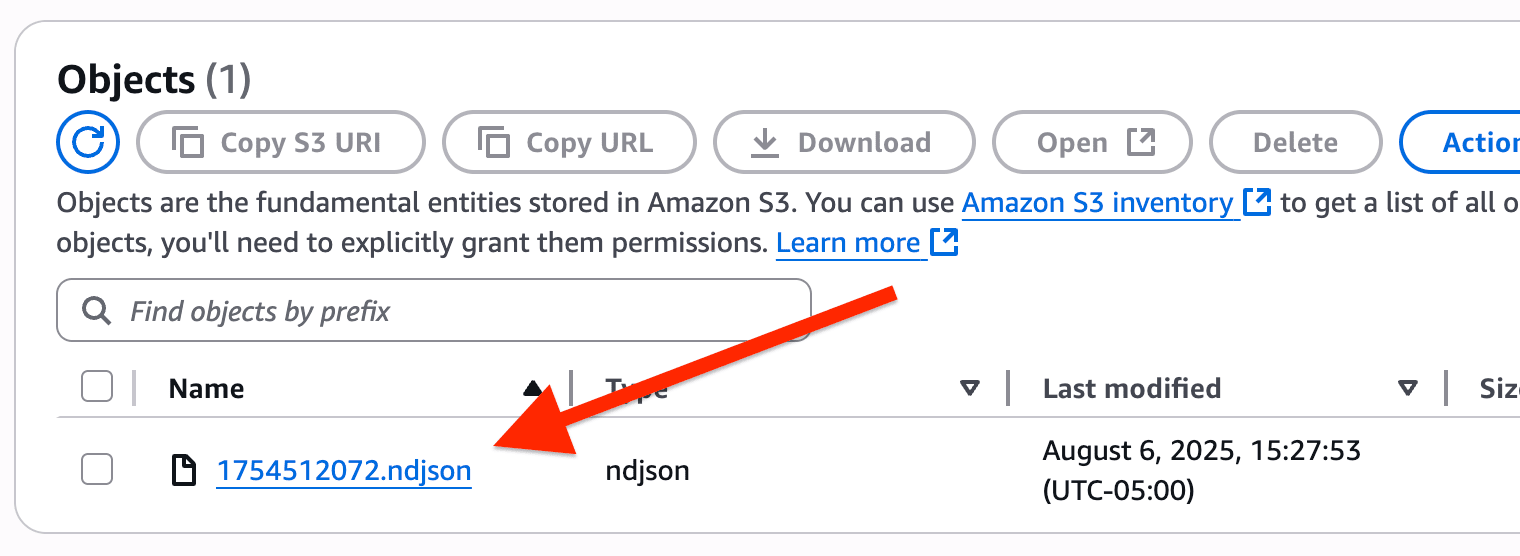
The data should look something like this:
{"humidity":27.524,"temp":21.003,"time":1754491388}If you do not see any files created in S3, there two places to look to debug the Route:
-
Check the Logs tab of your Notehub Route to see if AWS returned any error messages.
-
Navigate to CloudWatch in the AWS Management Console to find any error logs related to your Lambda function.
As new sensor readings are delivered to Notehub, they will be actively routed to your AWS Lambda function and saved in S3.
Remember, if you don't have any new Notes coming in to Notehub, you can always manually route existing Notes by (1) checking the box next to an event, (2) clicking the Route button, and (3) choosing the Route you would like to use.
Your next step is to create a visualization of your data using AWS QuickSight.
To debug a route or inspect the exact request Notehub sends to your third-party service, open an event in Notehub, click Route as cURL, and choose the appropriate HTTP-based route. The modal shows a cURL command that reproduces the same request Notehub makes, with secrets (API keys, passwords, etc.) replaced by placeholders.

Build Data Visualizations
Now that you have connected your Notehub Route to AWS, you can leverage the power of the AWS ecosystem and set up an AWS QuickSight dashboard to visualize your data.
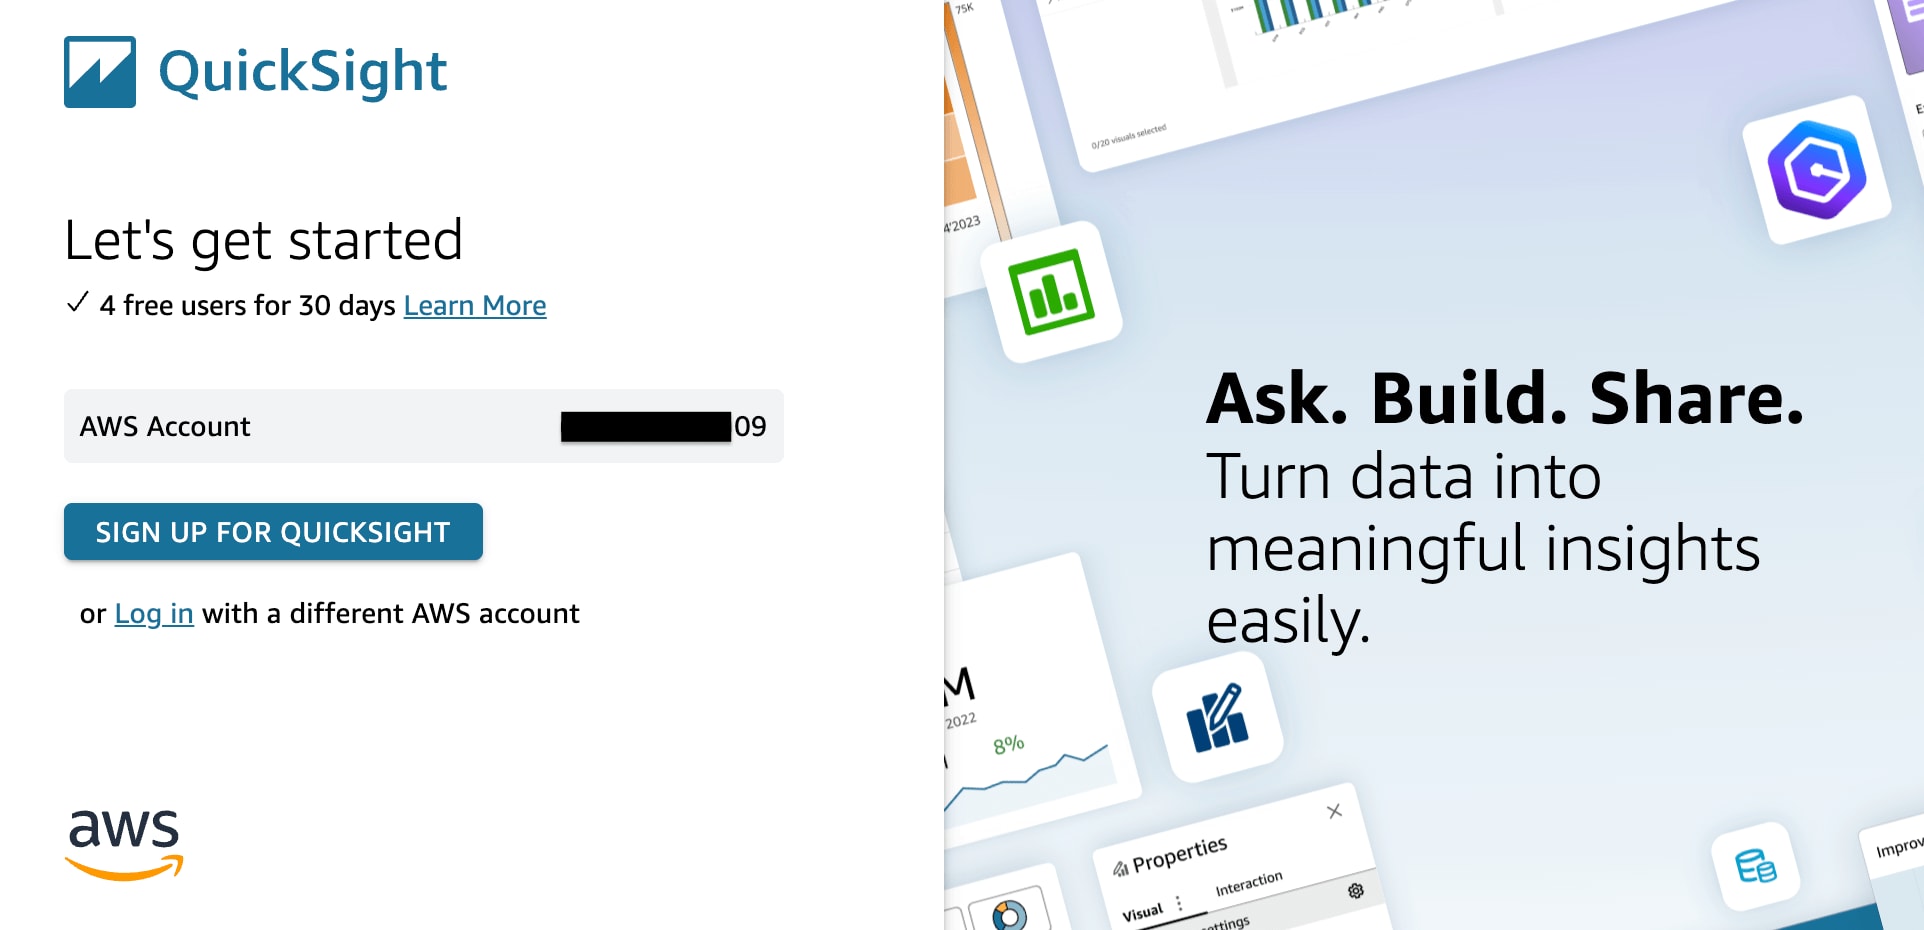
Create an AWS QuickSight Account
-
Navigate to AWS QuickSight and register for a QuickSight account.
 warning
Unlike most other AWS services, QuickSight is not billed based on usage. You will be charged a fee after 30 days whether or not you continue to use QuickSight!
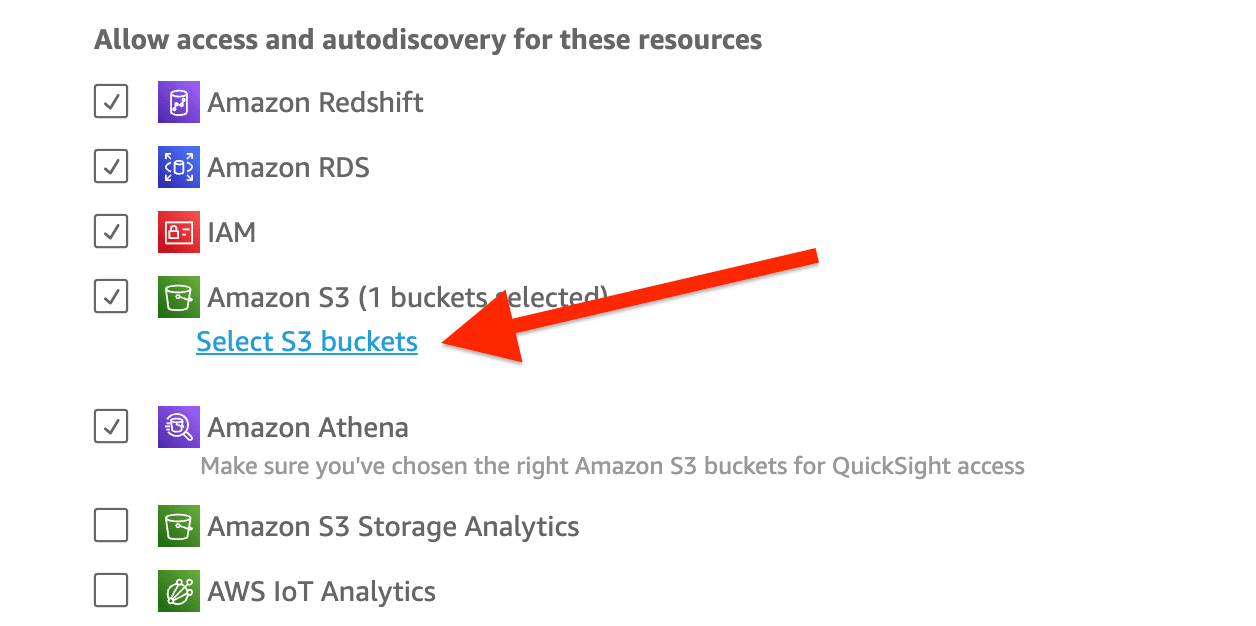
-
When setting up your account, use the default values provided. However, be sure to select the S3 bucket created earlier so QuickSight has access to it.
-
Next, you'll need to create a manifest file. This effectively tells QuickSight where it will find the data it needs to populate the dashboard. Save the following as
quicksight-manifest.json(replacingyour-s3-bucket-idwith your S3 bucket name). Save this file locally for now.{ "fileLocations":[ { "URIPrefixes":[ "s3://your-s3-bucket-id/" ] } ], "globalUploadSettings":{ "format":"JSON" } } -
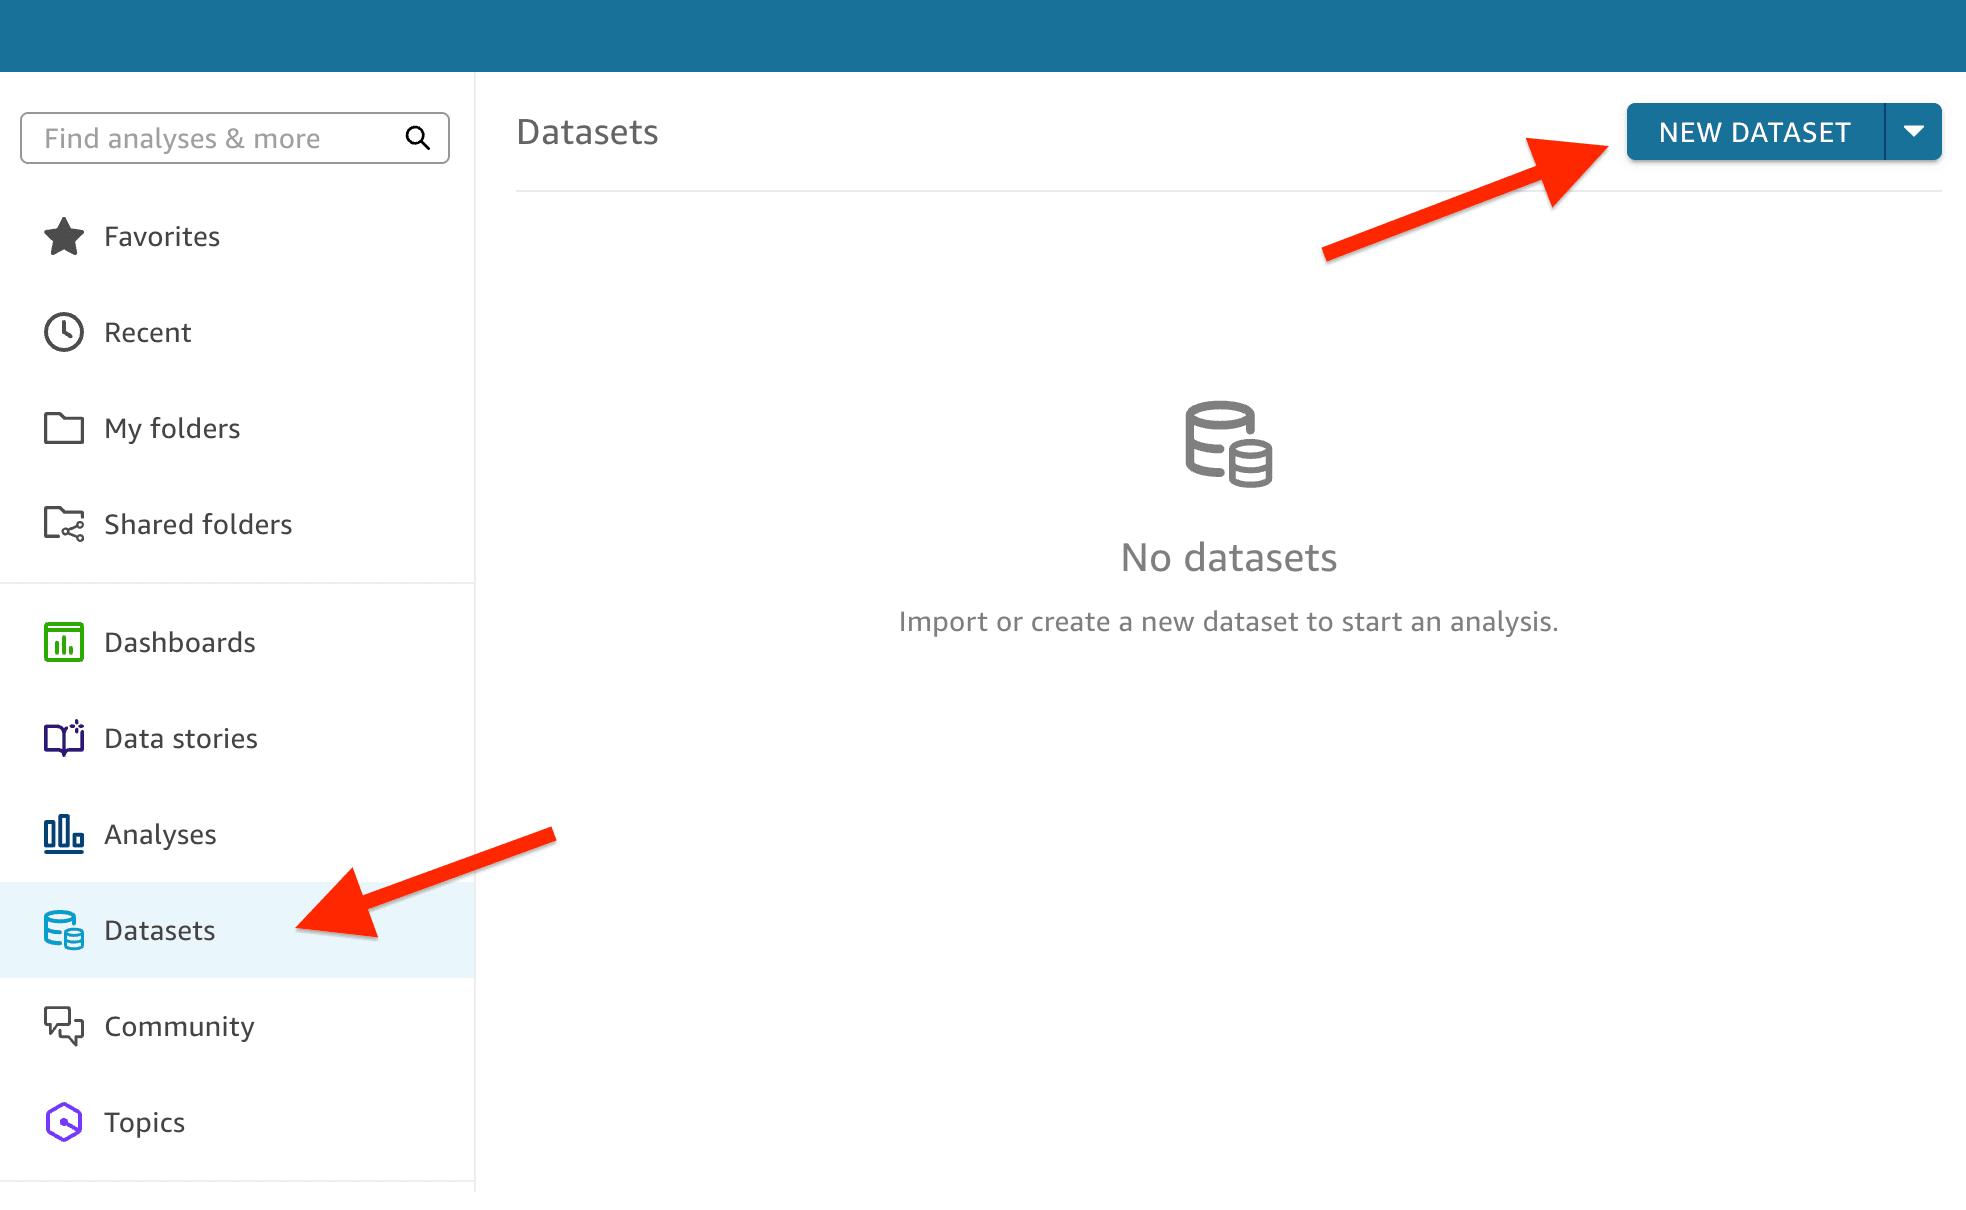
Navigate to the Datasets menu and click the NEW DATASET button.
-
Choose the Amazon S3 tile, provide a name for the Data source and upload the manifest file created in the previous step. Click Connect to proceed.

-
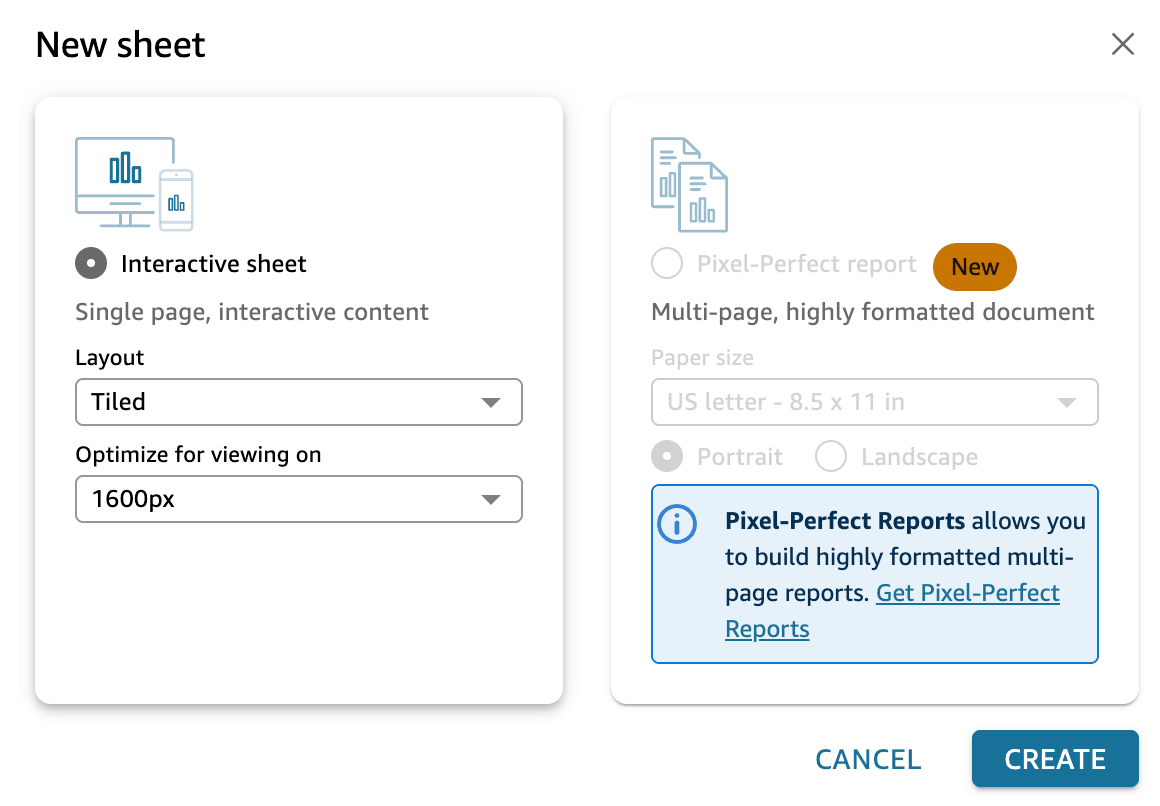
Next, click the Visualize button and you'll be provided with a New Sheet on which to create your visualizations. Click the CREATE button to begin.
-
Before assembling the chart, you need to convert the
timefield from anumber(as interpeted by QuickSight) to a UNIX Epoch timestamp. Under the Data menu, choose Datasets and edit your dataset.Then, add a new calculated field called
timestamp.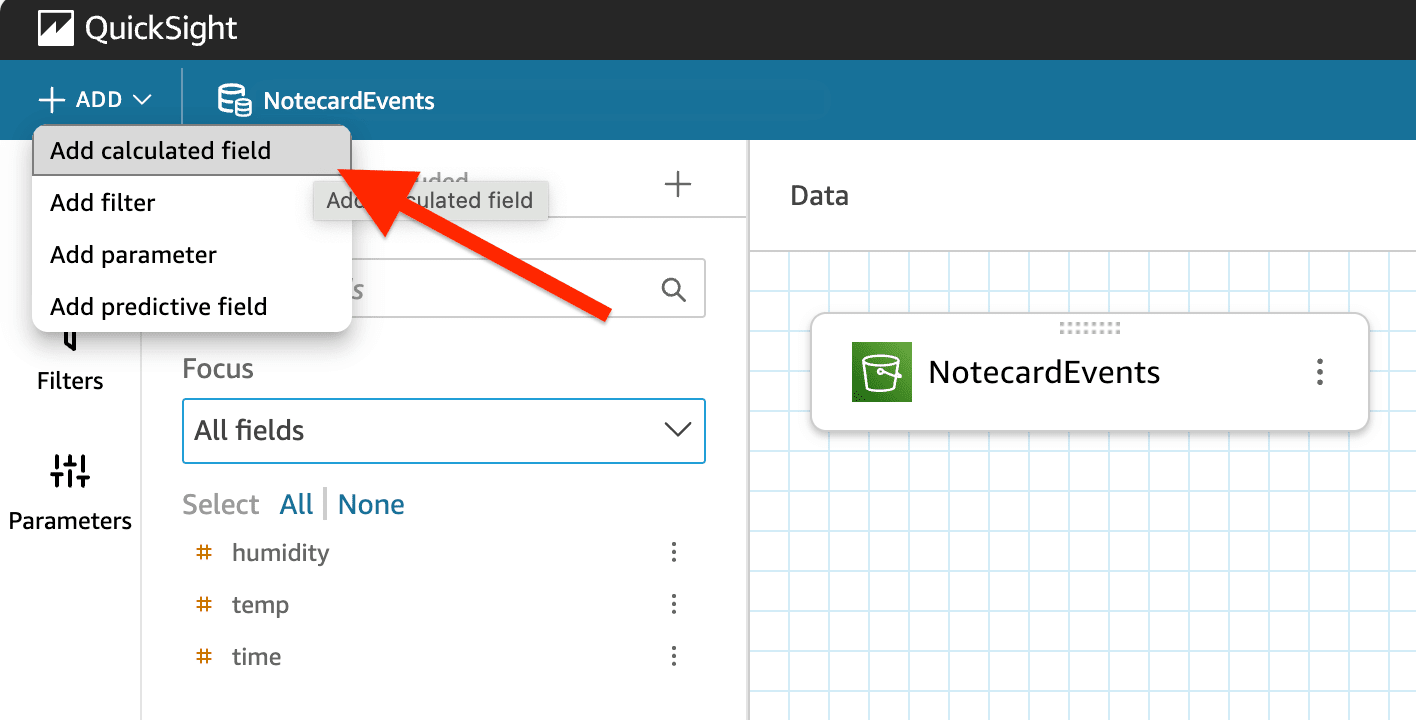
The formula for the calculated field is this:
epochDate({time}) -
Click on the Publish & Visualize button when you are done.
-
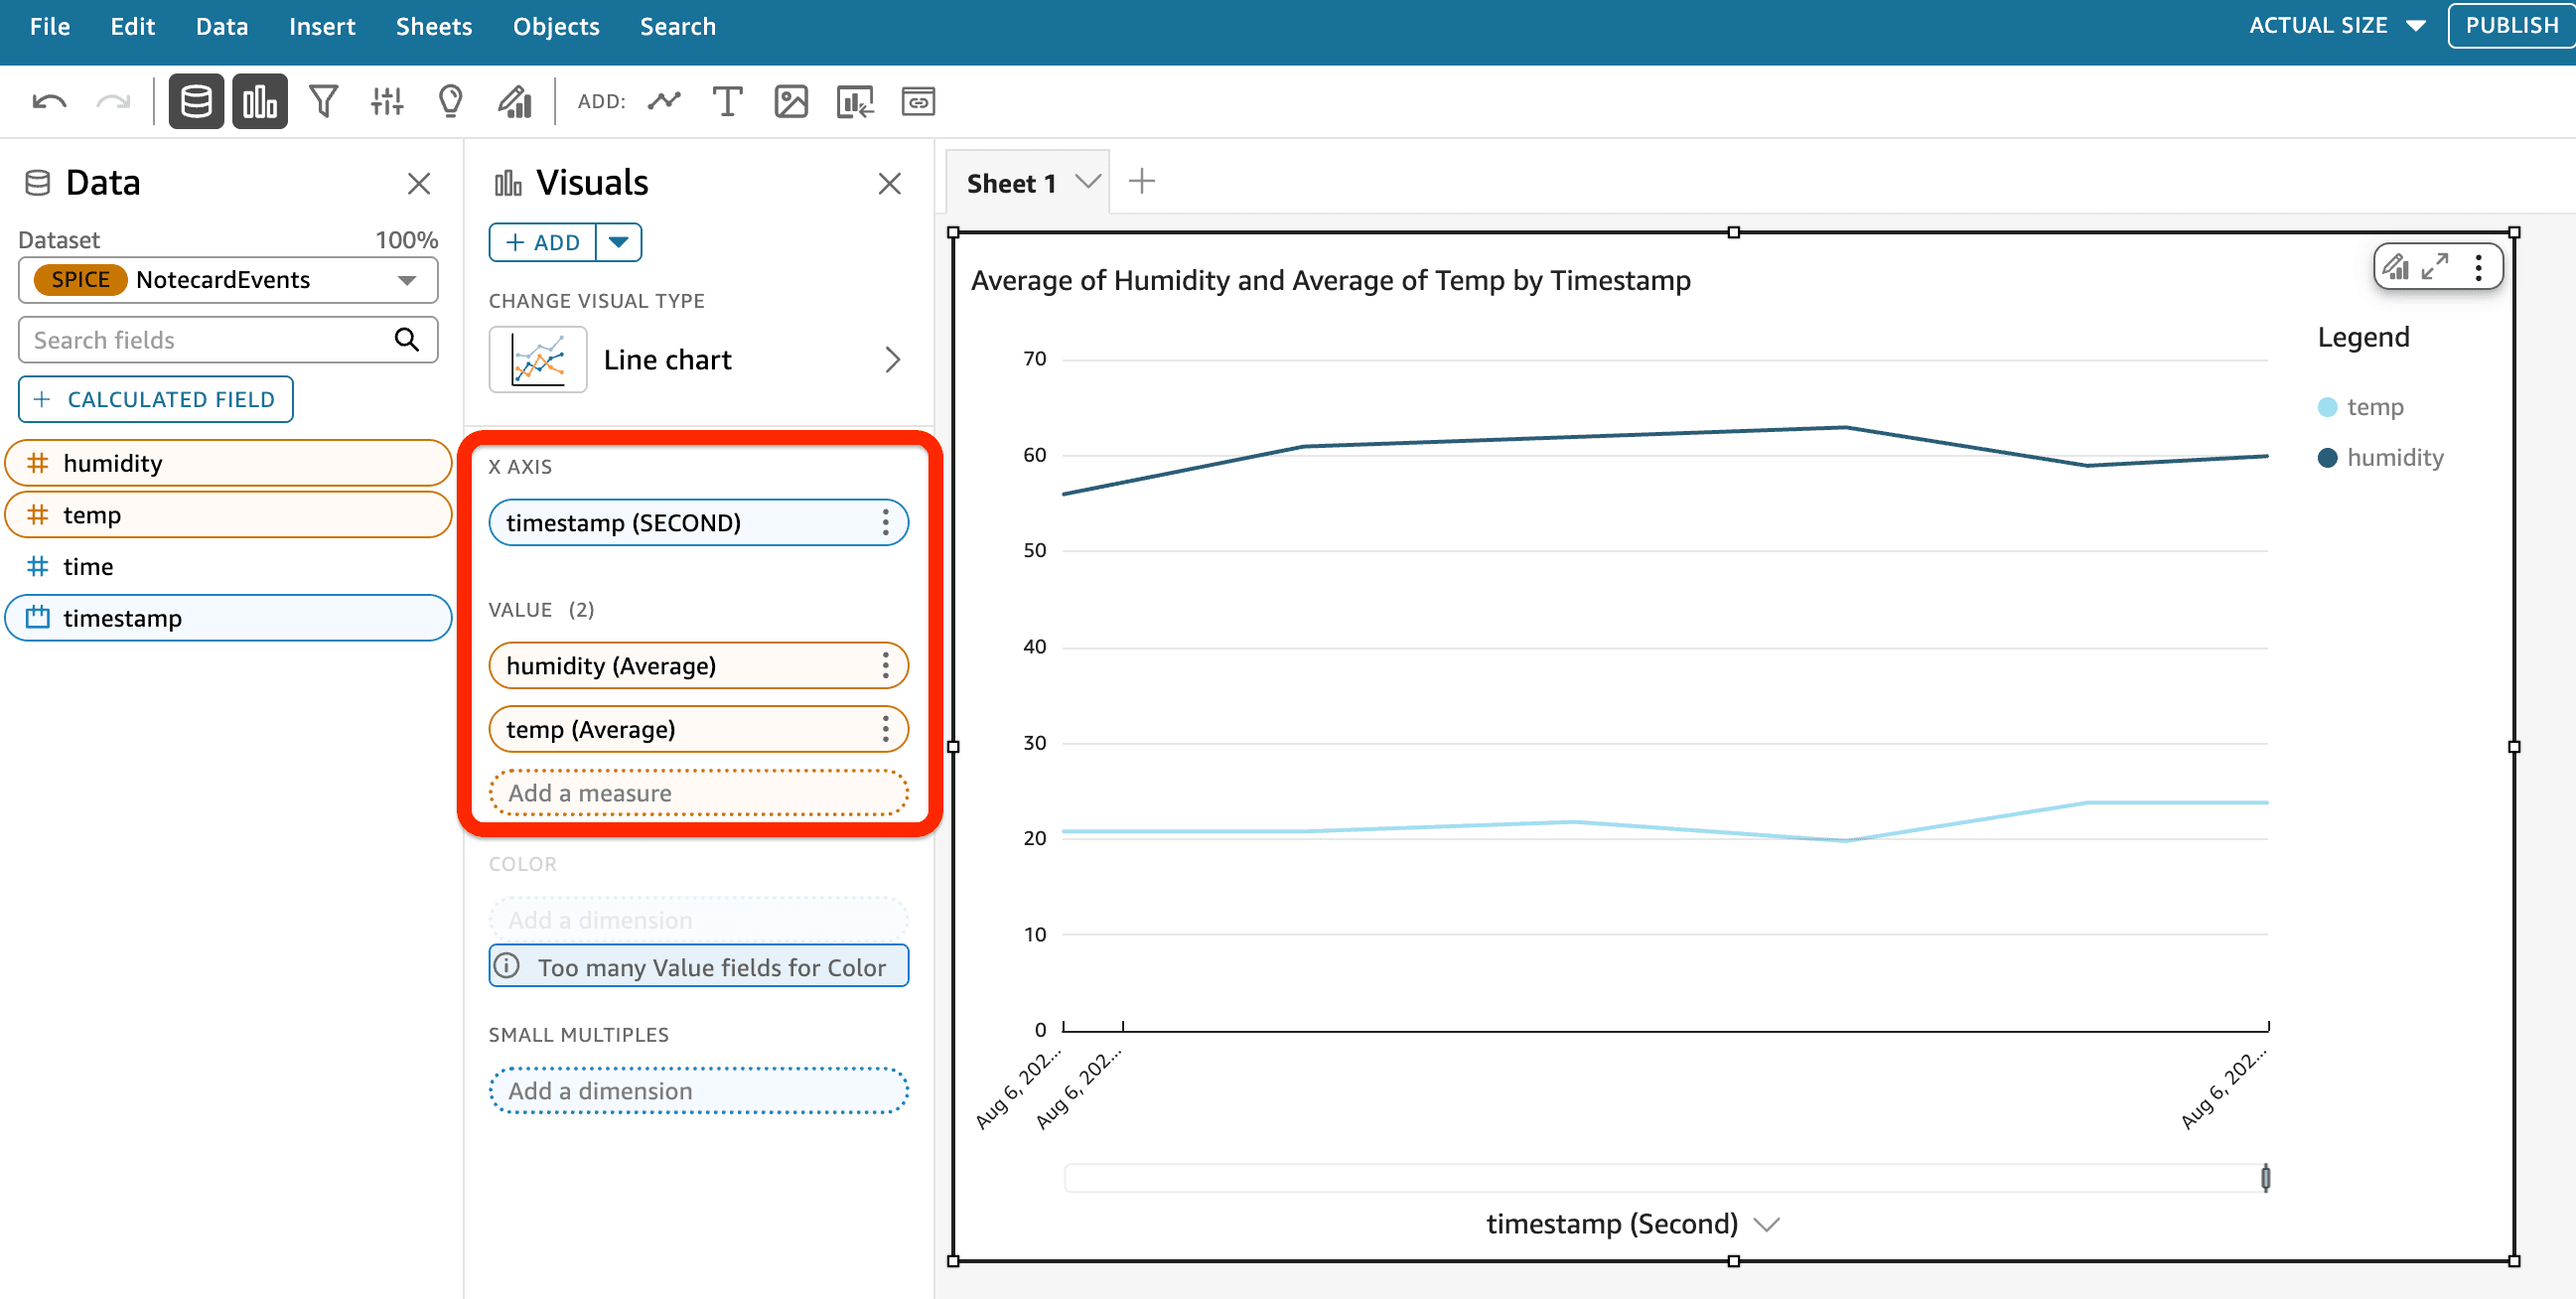
Finally, in the QuickSight sheet provided, add your calculated field
timestampto thex-axisof the Line Chart. Set the aggregation option to "second" (or whatever works best for your data). Add thetempandhumidityvalues to the value section and set both aggregation options to "average".From there, you should see a basic visualization of your data in QuickSight!
 note
noteBy default, your QuickSight dashboard will need its data refreshed from S3 manually from the Data > Dataset menu. However, you can schedule automatic refresh of data from S3 using these instructions.
Next Steps
Congratulations! You've created your first Route and connected your Notecard app to an external service. If you're following a Cell+WiFi Quickstart, you're done!
Now that you know the basics of how Notecard and Notehub work, you’re ready to apply what you’ve learned towards a real project. We have a few recommendations on what to do next:
-
Learn Best Practices for Production Projects: This skimmable guide has a list of best practices for moving your project from a prototype to a real, production-ready deployment.
-
Browse Example Apps: Our collection of IoT apps that show how to build common projects with Blues. These example apps include dozens of official Blues project accelerators and a collection of purpose-built sample apps.
-
Follow the Notehub Walkthrough: Learn how to manage projects and device fleets, update Notecard and host firmware, set up alerts, securely route your data, and more.
At any time, if you find yourself stuck, please reach out on the community forum.