Routing Data to Cloud: Initial State
Watch a video of this tutorial
In previous tutorials you've learned about the Blues Notecard, and used it to collect data and send it to Notehub, the Blues cloud service.
One powerful feature of Notehub is routes, which allow you to forward your data from Notehub to a public cloud like AWS, Azure, or Google Cloud, to a data cloud like Snowflake, to dashboarding services like Datacake or Ubidots, or to a custom HTTP or MQTT-based endpoint. The tutorial below guides you through sending data to several popular services, and teaches you how to build visualizations using that data.
Don't see a cloud or backend that you need? Notehub is able to route data to virtually any provider. If you're having trouble setting up a route, reach out in our forum and we will help you out.
Introduction
This tutorial should take approximately 30-40 minutes to complete.
In this tutorial, you'll learn how to connect your Notecard-powered app to Initial State, and learn how to start creating simple visualizations with sensor data.
This tutorial assumes you've already completed the initial
Sensor Tutorial to capture
sensor data, saved it in a Notefile called
sensors.qo, and sent that data through the Notecard to Notehub (or that
you've already created your own app with sensor data and are ready to connect
your app to external services).
Create a Route
A Route is an external API, or server location, where Notes can be forwarded upon receipt.
Routes are defined in Notehub for a Project and can target Notes from one or more Fleets or all Devices. A Project can have multiple routes defined and active at any one time.
Before you create a Route, ensure the data you want to route is available in Notehub by navigating to the Events view:

We'll start with a simple route that will pass Notecard events through to webhook.site, where you can view the full payload sent by Notehub. Using this service is a useful way to debug routes, add a simple health-check endpoint to your app, and familiarize yourself with Notehub's Routing capabilities.
-
Navigate to webhook.site. When the page loads, you'll be presented with a unique URL that you can use as a Route destination. Copy that URL for the next step.

-
Navigate to the Notehub.io project for which you want to create a route and click on the Routes menu item in the left nav.
-
Click Create Route.

-
Select the General HTTP/HTTPS Request/Response route type.

-
Give the route a name (for example, "Health").

-
For the Route URL, use the unique URL you obtained from webhook.site.

-
In the Filters section, choose Selected Notefiles and check the box(es) next to the Notefile(s) you want to route. For example, we used
sensors.qofor the sensor tutorial.
-
Make sure the Enabled switch at the top remains selected, and click Create Route.
-
Only Notes received after the Route is created are synced automatically. If new Notes have been received since you created the Route, proceed to the next step.
Alternatively, you can manually route existing Notes by (1) checking the box next to an event, (2) clicking the Route button, and (3) choosing the Route you would like to use:

-
Return to webhook.site. This page will update automatically with data sent from Notehub. The data from your sensor is contained within the
bodyattribute. Notice that Notehub provides you with a lot of information, by default. In the next section, we'll look at using transformations to customize what Notehub sends in a Route.
Use JSONata to Transform JSON
Before moving on to routing data to an external service, let's briefly explore using JSONata expressions to transform the data Notehub routes.
As mentioned above, Notehub provides a lot of information in each Route request. You may want to trim down what you send to the external service, or you might need to transform the payload to adhere to a format expected by that service. Either way, Notehub supports shaping the data sent to a Route using JSONata.
To learn more about JSONata later, have a look at the Blues JSONata Guide.
Transform Your Data
Let's try a simple query to the webhook.site Route created in the last section.
-
Navigate to the Routes page in Notehub and click on the Route you wish to edit.

-
In the Transform Data drop-down, select JSONata Expression.

-
In the JSONata Expression text area, add the following query to select the
tempandhumidityfrom thebody, create alocationfield that concatenates thetower_locationandtower_countryfields, and create atimefield.{ "temp": body.temp, "humidity": body.humidity, "location": tower_location & ', ' & tower_country, "time": when } -
Click Apply changes. Then, navigate back to webhook.site. As requests come in, you'll see your custom, JSONata-transformed payload in the Raw Content section.

 note
noteThe
tower_locationandtower_countryfields are only populated for events sent over cellular. For Starnote/satellite, LoRa or WiFi devices, those fields will be empty. If you want a single expression that works across connectivity types, use thebest_locationandbest_countryfields instead — Notehub appends those to every event, choosing the most accurate source available (GPS/GNSS, triangulation, or cell tower). See Data Notehub Appends to Events to learn more.
JSONata is simple, powerful, and flexible, and will come in handy as you create Routes for your external services. To explore JSONata further, visit our Blues JSONata Guide.
Route to an External Service
Now that you've created your first Route and learned how to use JSONata to shape the data sent by a Route, you can connect Notehub to an external service.
For this tutorial, you'll connect your app to Initial State, a data streaming and visualization tool that's easy to set-up and configure for IoT applications.
Set a Serial Number On Your Notecard
This tutorial requires each Notecard to have a
Serial Number
assigned. The Serial Number (sn) is a customer-defined string used to uniquely
identify a Notecard within a Fleet in Notehub
and is used by Initial State to group and name event data.
If your Notecard doesn't already
have an assigned Serial Number, set one by making a
hub.set request to the
Notecard and passing the Serial Number string into the sn field.
{
 "req": "hub.set",
 "sn": "scranton-12"
}
Create an Initial State Account
If you don't have one already, create an Initial State account.
Find Your Initial State API Key
-
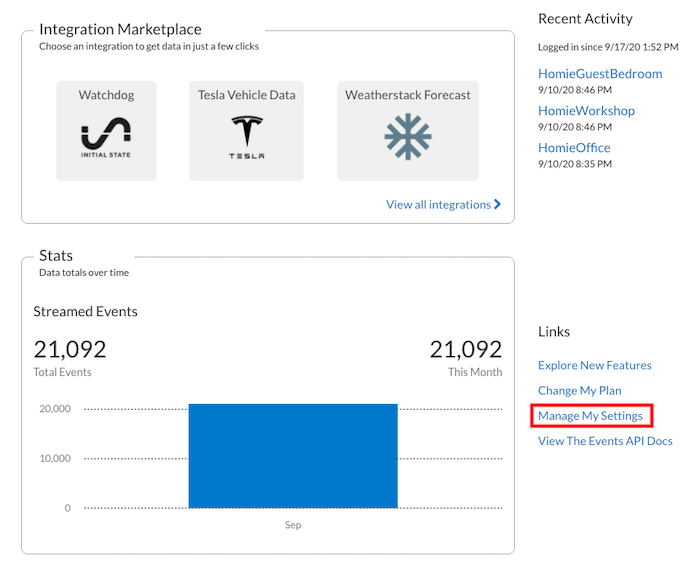
Once you've logged in, you'll need your Initial State API Key in order to create a Route in Notehub. Find it by clicking on the Manage My Settings link on your dashboard.
-
Find the Create A New Key button under the Access Keys heading, and click it to create a new key.

Create Routes in Notehub
When using Initial State with Notecard-based projects, you'll need to create two routes:
-
The first Route provisions your Notecard device with Initial State and creates a bucket to hold event data. This route will only run once per session (e.g. when Notehub sees a
_session.qoNote). -
The second Route runs each time your Notecard syncs and adds relevant sensor data from
sensors.qoNotes.
Create a Provisioning Route for Device Onboarding
-
Open the Routes dashboard in Notehub and click the Create Route button.
-
Select the General HTTP/HTTPS Request/Response Route type.
-
Give the Route a name like "Initial State Device Provisioning". In the URL field, enter
https://groker.init.st/api/buckets. -
In the HTTP Headers dropdown, select Additional Headers, and enter the following header names and values:
Header Name Header Value Accept-Version~0Content-Typeapplication/jsonX-IS-AccessKeyYour Initial State API Key
-
To ensure that this Route only runs once per session, change the Notefiles dropdown to Select Notefiles and enter
_session.qoin the Include Other Notefiles input box. -
In the Transform JSON field, select JSONata Expression and enter the following expression to set your DeviceUID as the
bucketKeyand Device Serial Number as thebucketName.$exists(body.opened) and body.opened = true ? { "bucketKey": $substringAfter(device, ":"), "bucketName": sn } : $doNotRoute()noteThis expression uses a custom Notehub JSONata function to prevent routing under certain conditions. In this case Notehub will only route this event when the session is
opened. -
Click Create Route to save your new Route.
-
To start a new session you can: restart your host, power cycle the Notecard, or send a
card.restartcommand to the Notecard. After your Notecard initiates a new session, this provisioning Route will run and create the bucket. Once created, the bucket will appear in the left-hand menu on your Initial State dashboard.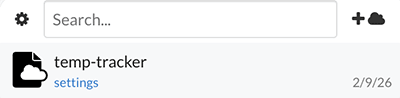
Create a Route for Streaming Data
Next, create a Route for streaming data. This Route will run each time you sync
data from the sensors.qo Notefile.
-
Open the Routes dashboard in Notehub and click the Create Route button.
-
Select the General HTTP/HTTPS Request/Response Route type.
-
Give the Route a name like "Initial State Device Data", and for the URL enter
https://groker.init.st/api/events. -
In the HTTP Headers dropdown, select Additional Headers and enter the following header names and values. These are the same three headers from your provisioning Route, plus your Bucket Key, which you can get from the Settings of your bucket in your Initial State dashboard.
Header Name Header Value Accept-Version~0Content-Typeapplication/jsonX-IS-AccessKeyYour Initial State API KeyX-IS-BucketKeyYour Initial State Bucket Key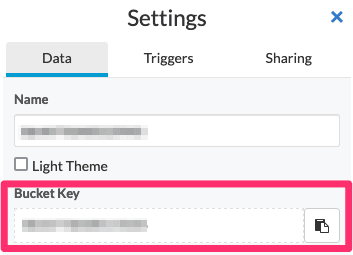
-
Change the Rate Limit to Limited Request Rate and set the Requests per Second value to
3, which is Initial State's limit. -
In the Notefiles field, choose Select Notefiles, and select
sensors.qo. -
In the Transform JSON field, select JSONata Expression, and paste in the following JSONata expression. This expression converts the data from the Notecard into an array of key-value pairs, which is the format Initial State expects.
[ {"key": "temp", "value": body.temp }, {"key": "humidity", "value": body.humidity} ] -
Make sure the route is enabled and click Create Route.
-
Navigate back to your Initial State dashboard and click on your bucket in the left menu.
noteRemember, if you don't have any new Notes coming in to Notehub, you can always manually route existing Notes by (1) checking the box next to an event, (2) clicking the Route button, and (3) choosing the Route you would like to use.
-
As data flows into Initial State from Notehub, the bucket dashboard will update with sensor data!

To debug a route or inspect the exact request Notehub sends to your third-party service, open an event in Notehub, click Route as cURL, and choose the appropriate HTTP-based route. The modal shows a cURL command that reproduces the same request Notehub makes, with secrets (API keys, passwords, etc.) replaced by placeholders.

Build Data Visualizations
Initial State provides a default tile visualization for each key you provide (referred to as a "signal") , but there's a lot more you can do to customize the dashboard to your liking.
Moving and Resizing Dashboard Tiles
-
To move dashboard tiles, click the Edit Tiles menu item at the top left of the screen.
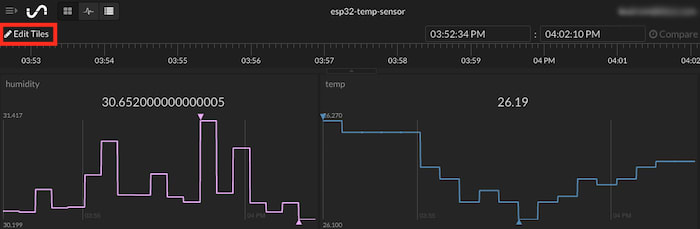
-
Once in edit mode, you can click a tile corner to resize it, or drag it to a new location on the screen.

Modifying Tiles
Next, lets modify the default temp and humidity tiles.
-
While still in edit mode, click on the
temptile. A modal appears with a number of options.
-
Change the Tile Type to a Line Graph. Then, click on the settings icon next to the
tempsignal key. Set the label to "Temperature" and click the Show Area Fill checkbox. The sample graph at the top of the modal updates as you make changes. -
Next, change the Path Style to Straight Line and click the
xicon to close the modal.
-
Finally, click on the
humiditytile, and repeat the steps above. Be sure to set the signal key label to "Humidity."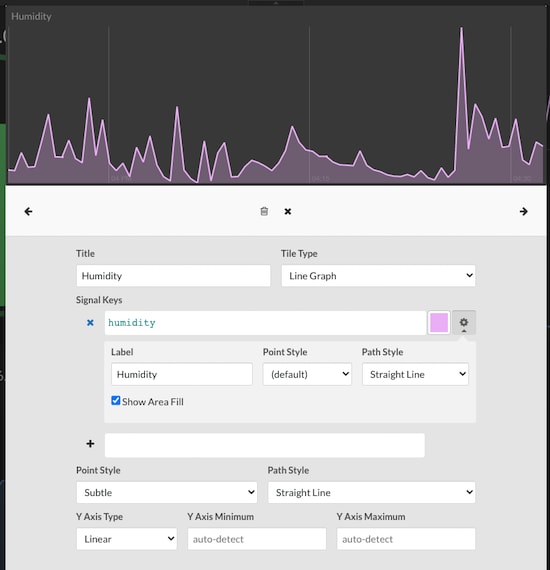
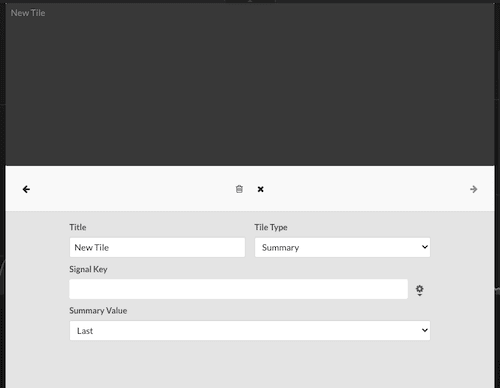
Adding New Tiles
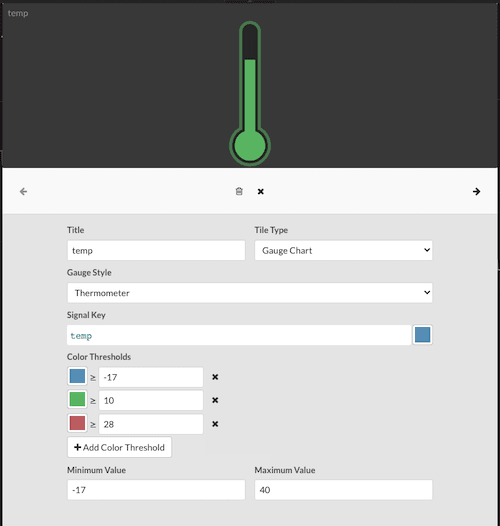
Lets wrap up by adding a new title. This one will use the temperature signal to show the current temperature on a thermometer with color thresholds.
-
While in edit mode, click the Add Tile menu item.
-
Set the Title to "Current Temp" and select Gauge Chart for the Tile Type.

-
Set the Gauge Style to Thermometer and select
tempfor the Signal Key. -
Next, add three color threshold values with colors blue, green and red to indicate where the current temperature falls in the range. Set values for each threshold as you see fit.
For instance, in the image below, the blue range is set to
>= -17degrees centigrade, green>= 10degrees, and red>= 28degrees. -
Set a Minimum Value and Maximum Value you expect to see from the sensor.
-
Click the
xicon to close the modal. You now have a real-time view of your sensor data routed from Notehub to Initial State!
Next Steps
Congratulations! You've created your first Route and connected your Notecard app to an external service. If you're following a Cell+WiFi Quickstart, you're done!
Now that you know the basics of how Notecard and Notehub work, you’re ready to apply what you’ve learned towards a real project. We have a few recommendations on what to do next:
-
Learn Best Practices for Production Projects: This skimmable guide has a list of best practices for moving your project from a prototype to a real, production-ready deployment.
-
Browse Example Apps: Our collection of IoT apps that show how to build common projects with Blues. These example apps include dozens of official Blues project accelerators and a collection of purpose-built sample apps.
-
Follow the Notehub Walkthrough: Learn how to manage projects and device fleets, update Notecard and host firmware, set up alerts, securely route your data, and more.
At any time, if you find yourself stuck, please reach out on the community forum.