
Routing Data to Cloud: Snowflake Snowpipe Streaming
Watch a video of this tutorial
In previous tutorials you've learned about the Blues Notecard, and used it to collect data and send it to Notehub, the Blues cloud service.
One powerful feature of Notehub is routes, which allow you to forward your data from Notehub to a public cloud like AWS, Azure, or Google Cloud, to a data cloud like Snowflake, to dashboarding services like Datacake or Ubidots, or to a custom HTTP or MQTT-based endpoint. The tutorial below guides you through sending data to several popular services, and teaches you how to build visualizations using that data.
Don't see a cloud or backend that you need? Notehub is able to route data to virtually any provider. If you're having trouble setting up a route, reach out in our forum and we will help you out.
Introduction
This tutorial should take approximately 30-40 minutes to complete.
In this tutorial, you'll learn how to connect your Notecard-powered app to Snowflake Snowpipe Streaming, and learn how to start creating simple visualizations with sensor data.
This tutorial assumes you've already completed the initial
Sensor Tutorial to capture
sensor data, saved it in a Notefile called
sensors.qo, and sent that data through the Notecard to Notehub (or that
you've already created your own app with sensor data and are ready to connect
your app to external services).
Create a Route
A Route is an external API, or server location, where Notes can be forwarded upon receipt.
Routes are defined in Notehub for a Project and can target Notes from one or more Fleets or all Devices. A Project can have multiple routes defined and active at any one time.
Before you create a Route, ensure the data you want to route is available in Notehub by navigating to the Events view:
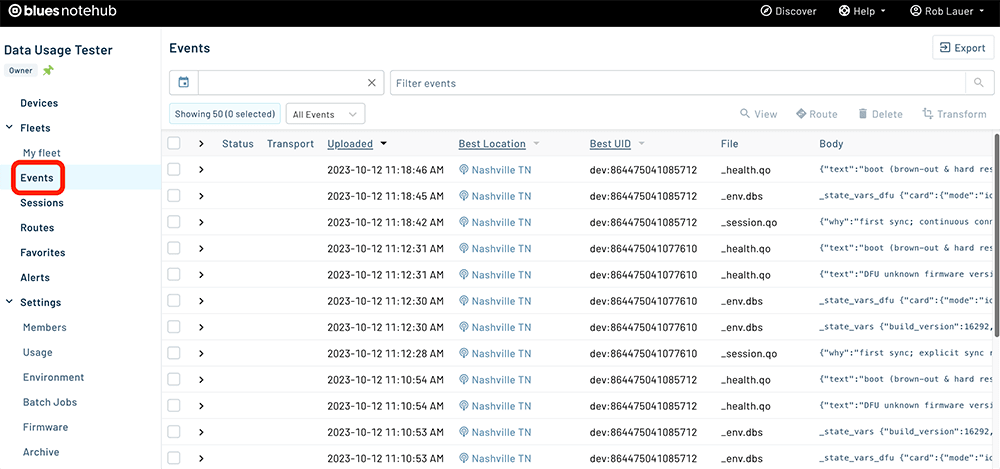
We'll start with a simple route that will pass Notecard events through to webhook.site, where you can view the full payload sent by Notehub. Using this service is a useful way to debug routes, add a simple health-check endpoint to your app, and familiarize yourself with Notehub's Routing capabilities.
-
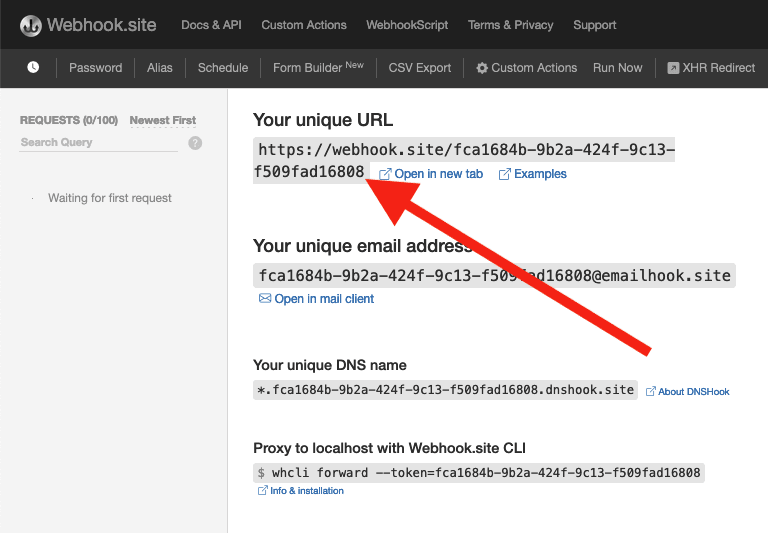
Navigate to webhook.site. When the page loads, you'll be presented with a unique URL that you can use as a Route destination. Copy that URL for the next step.
-
Navigate to the Notehub.io project for which you want to create a route and click on the Routes menu item in the left nav.
-
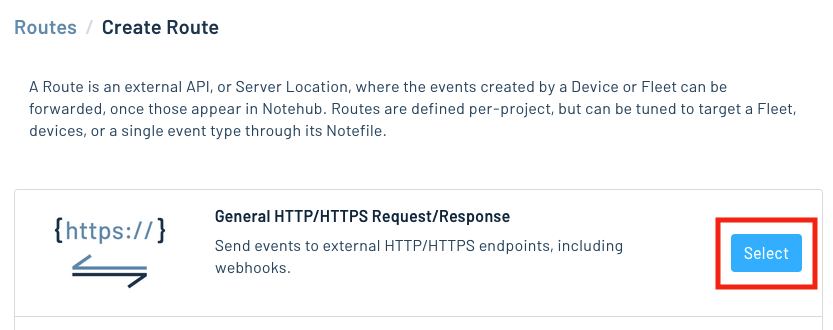
Click Create Route.

-
Select the General HTTP/HTTPS Request/Response route type.
-
Give the route a name (for example, "Health").

-
For the Route URL, use the unique URL you obtained from webhook.site.

-
In the Filters section, choose Selected Notefiles and check the box(es) next to the Notefile(s) you want to route. For example, we used
sensors.qofor the sensor tutorial.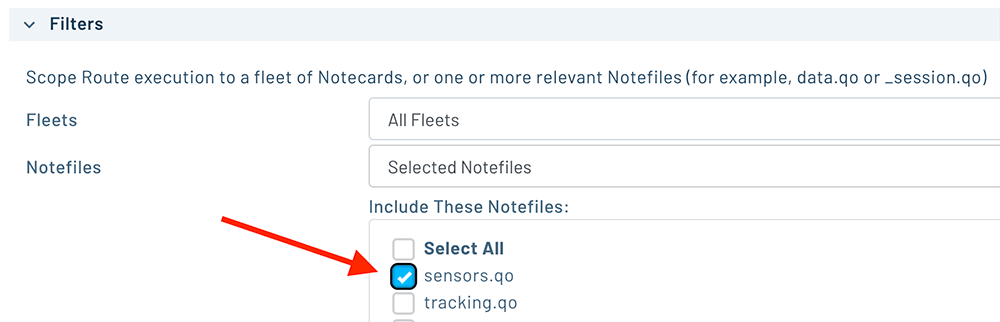
-
Make sure the Enabled switch at the top remains selected, and click Create Route.
-
Only Notes received after the Route is created are synced automatically. If new Notes have been received since you created the Route, proceed to the next step.
Alternatively, you can manually route existing Notes by (1) checking the box next to an event, (2) clicking the Route button, and (3) choosing the Route you would like to use:
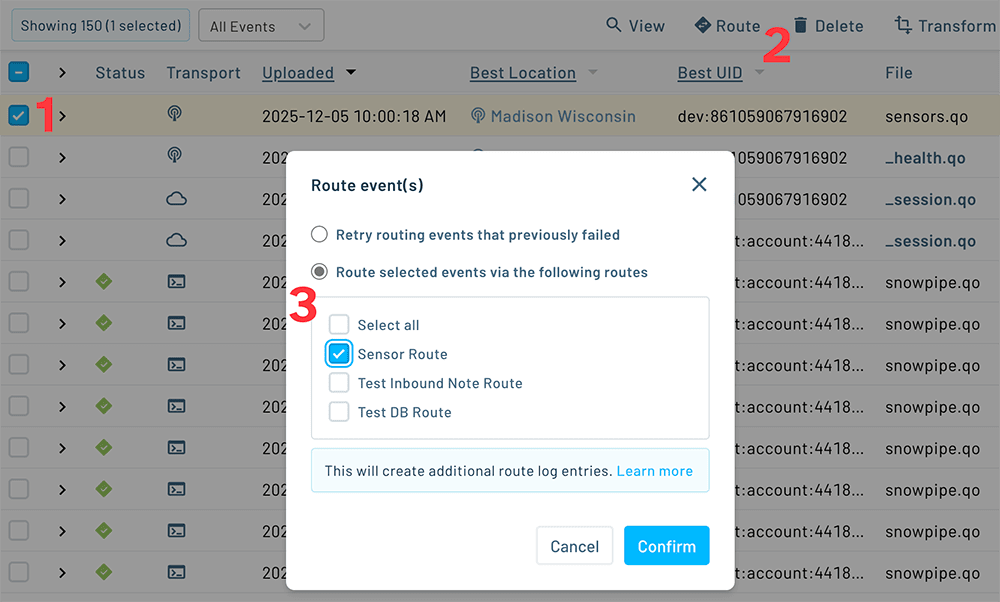
-
Return to webhook.site. This page will update automatically with data sent from Notehub. The data from your sensor is contained within the
bodyattribute. Notice that Notehub provides you with a lot of information, by default. In the next section, we'll look at using transformations to customize what Notehub sends in a Route.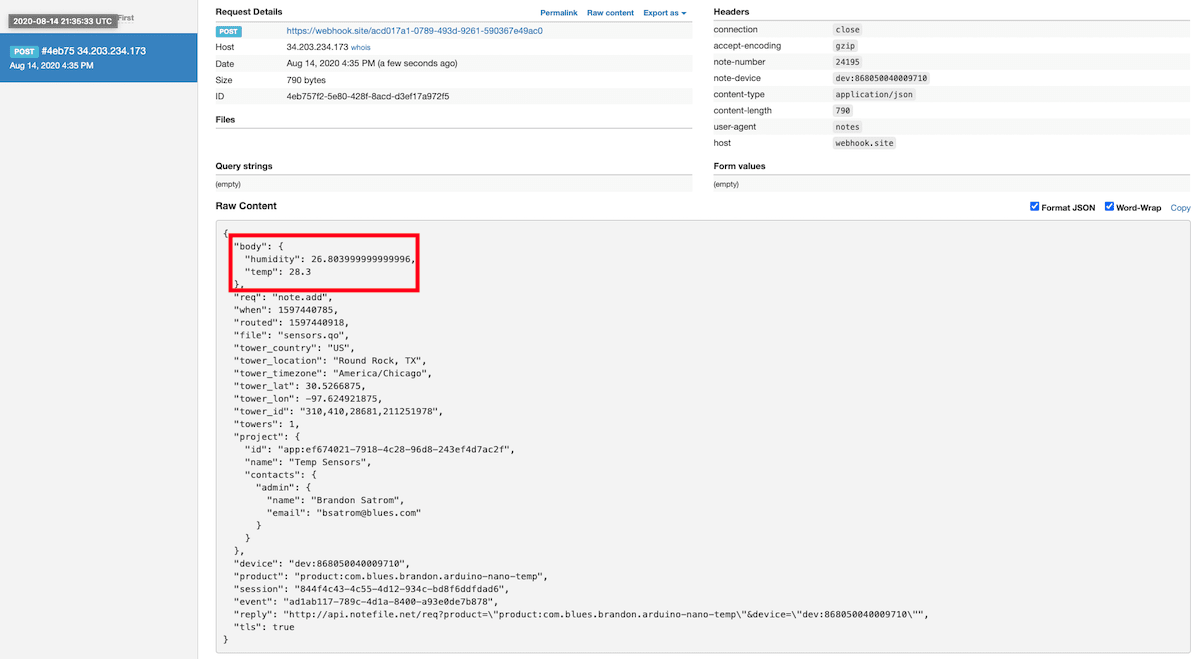
Use JSONata to Transform JSON
Before moving on to routing data to an external service, let's briefly explore using JSONata expressions to transform the data Notehub routes.
As mentioned above, Notehub provides a lot of information in each Route request. You may want to trim down what you send to the external service, or you might need to transform the payload to adhere to a format expected by that service. Either way, Notehub supports shaping the data sent to a Route using JSONata.
 note
noteTo learn more about JSONata later, have a look at the Blues JSONata Guide.
Transform Your Data
Let's try a simple query to the webhook.site Route created in the last section.
-
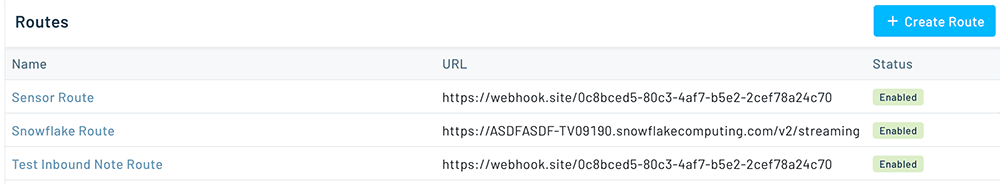
Navigate to the Routes page in Notehub and click on the Route you wish to edit.
-
In the Transform JSON drop-down, select JSONata Expression.

-
In the JSONata Expression text area, add the following query to select the
tempandhumidityfrom thebody, create alocationfield that concatenates thetower_locationandtower_countryfields, and create atimefield.{ "temp": body.temp, "humidity": body.humidity, "location": tower_location & ', ' & tower_country, "time": when } -
Click Apply changes. Then, navigate back to webhook.site. As requests come in, you'll see your custom, JSONata-transformed payload in the Raw Content section.

JSONata is simple, powerful, and flexible, and will come in handy as you create Routes for your external services. To explore JSONata further, visit our JSON Fundamentals guide.
Route to an External Service
Now that you've created your first Route and learned how to use JSONata to shape the data sent by a Route, you can connect Notehub to an external service.
In this section, you'll connect your app to Snowflake using Snowpipe Streaming. Snowpipe Streaming is Snowflake's service for continuous, low-latency loading of streaming data directly into Snowflake. At the end, you'll build an interactive app for data visualization using Streamlit.
Create a Snowflake Account
If you haven't already, create a Snowflake account. The provided 30-day trial should be plenty to get you started exploring the product.

Create a Public Private Key Pair for Authentication
-
Follow this guide from Snowflake to configure a public and private key for key pair authentication between Notehub and Snowflake. You will end up with two files that should be stored securely:
rsa_key.p8andrsa_key.pub. -
Once you've created a public key (
rsa_key.pub), you'll need to associate it with your Snowflake user account (or you can create a separate dedicated ingestion role/user).Open or create a new Worksheet in your Snowflake portal and run the following, replacing the username and public key values:
alter user [your_user_name] set rsa_public_key='MIIBIjANBgkqh...'; -
Then, run
desc user [your_user_name];and verify that your key is set in theRSA_PUBLIC_KEYfield.
Notehub will ask for the Private key (rsa_key.p8) when creating the Route, so
be sure to save that file in a location you'll remember later.
Create a Snowflake Database and Table
Next, you'll need to create a Database and Table in your Snowflake Account.
-
Open or create a Worksheet and run the following three commands to: create a database, set it as active for future statements, and create a schema.
create or replace database sensor_db; use database sensor_db; create or replace schema public; -
Create a table with a single column of type
variant. The variant data type is a container for the raw JSON that we'll be routing from Notehub to Snowflake. Snowflake also has a mechanism for creating structured data from semi-structured sources like JSON, which you'll explore in the next part of this tutorial.create or replace table sensor_data(payload variant);Snowpipe Streaming will be configured to append each Notehub event as a new row in
sensor_data, populating thepayloadVARIANT column directly. -
Next, create a Snowpipe Streaming PIPE using the following query:
use database sensor_db;
use schema public;

create or replace pipe notehub_streaming_pipe
as
copy into sensor_db.public.sensor_data (payload)
from (
  select $1
  from table(DATA_SOURCE(TYPE => 'STREAMING'))
);
Create a Route in Notehub
-
To create a Snowpipe Streaming Route, you'll need to grab your organization and account name from Snowflake. You can find these in your Snowflake account dashboard at the lower left.

-
Next, open your Notehub project, click the Routes item in the left navigation and click Create Route in the top right.
-
Click the Select button in the "Snowflake Snowpipe Streaming" row.

-
Give the Route a name, and in the configuration section, enter data in the following required fields:
- Organization Name - The organization name retrieved from your Snowflake account settings.
- Account Name - The account name retrieved from your Snowflake account settings.
- Database Name - The database you created above (e.g.
sensor_db). - Schema Name - The database schema you created above (e.g.
public). - Pipe Name - The PIPE name created above (e.g.
notehub_streaming_pipe). - User Name - The user name you are using to connect Notehub to Snowflake.
- Private Key - The private key file you generated earlier (e.g.
rsa_key.p8).

-
In the Filters section, choose "Selected Notefiles" and select your
sensors.qoNotefile.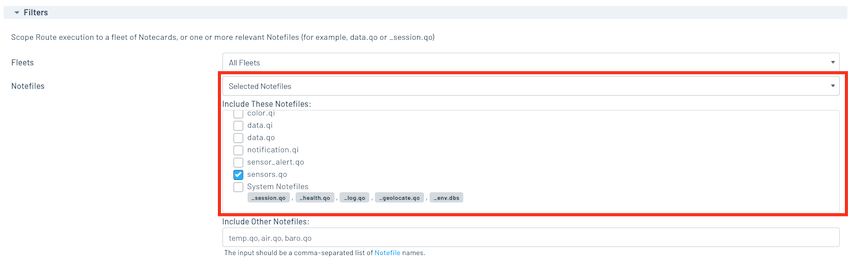
-
Finally, click the Apply changes button to save your Route.
-
To confirm that your Route is working as Notehub receives events from your Notecard, click the Logs tab in your Route and look for a green checkbox. This confirms the event has been handed off to Snowpipe Streaming for ingestion.

-
On the Snowflake side, navigate to your Worksheet and run the following query:
select * from sensor_data; -
You should see a JSON object in the
payloadfield for each sensor reading from your Notecard.
With data flowing from the Notecard through Notehub to Snowflake, your next step is to create a UI for data visualization using Streamlit.
Build Data Visualizations
In this section, you'll learn how to shape semi-structured JSON data into views for easier querying, and then use the open source Streamlit framework to create a dashboard for your sensor data.
Create Snowflake Views from JSON Data
In the last section, you created a Route to send raw JSON from Notehub to Snowflake and store that data in a table, unmodified. One powerful feature that Snowflake provides is the ability to stream your Notehub events as they arrive and then process and shape that data at a later point without modifying your Notehub Route.
This is possible because Snowflake can recognize valid JSON in a variant field
of a table, traverse the JSON object, and select data from it. As a result, we
can create views in Snowflake that apply structure to semi-structured JSON data
sent from Notehub without affecting the underlying data.
-
In your Snowflake dashboard, create or open a Worksheet and run the following query to switch to your sensor database.
use database sensor_db; -
Next, run the following to create a view. Notice that the
payload:syntax allows you to select fields directly from the raw JSON from Notehub, and you can even traverse objects and select properties from the event body using dot notation.create or replace view sensor_vw as select payload:event::STRING as id, payload:device::STRING as device, payload:when::TIMESTAMP as created, payload:best_lat::FLOAT as lat, payload:best_lon::FLOAT as lon, payload:best_location::STRING as location, payload:best_location_type::STRING as location_type, payload:best_timezone::STRING as timezone, payload:best_country::STRING as country, payload:body.temp::FLOAT as temp, payload:body.humidity::FLOAT as humidity from sensor_data; -
Finally, run the following to see the results of your view: a structured table with the schema you defined above.
select * from sensor_vw;
Create a Streamlit App to Vizualize Sensor Data
Now let's create a simple Streamlit app to retrieve sensor readings and visualize data. Streamlit is an open-source Python library that makes it easy to build web apps using popular Python data packages like Numpy and Pandas. It also provides an integration with Snowflake, which is perfect for this guide. Streamlit does provide a hosted cloud for Streamlit apps, but for this tutorial you'll use the local version.
-
First, use this guide to install Streamlit locally.
-
Create a directory for your application, like
streamlit-sensors, and navigate inside it. -
If you didn't already, set up a virtual environment for the app. Open your terminal and run the following to create and activate a Python virtual environment:
python3 -m venv env source env/bin/activate -
Add a file called
requirements.txtwith the following content:altair pandas streamlit snowflake-connector-python matplotlib -
Run this command to install all of the needed dependencies in your virtual environment.
pip install -r requirements.txt -
Create a directory called
.streamlitand add a file inside of that directory calledsecrets.toml. Add the following, making sure to replace the placeholder text with your username, password, and Snowflake organization and account name.[snowflake] user = "[your_user_name]" password = "[your_password]" account = "[your_organization_name]-[your_account_name]" warehouse = "COMPUTE_WH" database = "SENSOR_DB" schema = "PUBLIC" -
Create a new file in the app root directory called
streamlit_app.pyand open it in your text editor of choice. -
Add the following imports to the top of the file:
import streamlit as st import pandas as pd import snowflake.connector -
Next, add some logic to connect to your Snowflake database, as well as a function to handle queries to your sensor data.
# Initialize connection. @st.cache_resource def init_connection(): return snowflake.connector.connect(**st.secrets["snowflake"]) conn = init_connection() # Perform query. @st.cache_data(ttl=600) def run_query(query): with conn.cursor() as cur: cur.execute(query) return cur.fetchall() -
Streamlit has some built-in smarts that can turn multi-line comments and markdown into content on the resulting web page. Add the following, which Streamlit will process as a header element and text when the page is rendered.
""" # Notecard Sensor Data This page shows sensor readings and device location from a Blues Notecard-connected device. """ -
Streamlit also provides a number of form elements that can be used to add interactivity to your app. The values of form elements are bound to variables, and as those variables change, dependent data and UI elements change as well. Add the following to your app to add a slider, select box, and a few checkboxes.
""" ### Options """ num_rows = st.slider('Rows to fetch?', 10, 500, 100) sort = st.selectbox('Sort?',('asc', 'desc')) show_table_data = st.checkbox('Show table data?', True) show_charts = st.checkbox('Show charts?', True) show_map = st.checkbox('Show map?', False) -
Now run the app. Navigate back to your terminal and run the following:
streamlit run streamlit_app.py -
As the app loads, Streamlit will open a new tab in your browser and render the page with the elements you provided above.

-
Next, add the following lines to fetch data from Snowflake and place that data into a Pandas DataFrame. Notice that we're using a Python format string and the
sortandnum_rowsvariables in the query. As mentioned above, these variables are bound to the UI elements on the page, and as they change, the query will re-run.sensor_rows = run_query( f"SELECT * from sensor_vw ORDER BY created {sort} LIMIT {num_rows};" ) sensor_data = pd.DataFrame( sensor_rows, columns=( "ID", "Device", "When", "lat", "lon", "Location", "Location Type", "Timezone", "Country", "Temp", "Humidity", ), ) -
With a DataFrame in hand, we can add our first visualization, starting with a simple table view of all sensor readings.
if show_table_data: """ ## Notecard `sensors.qo` Events """ # Flip the column order to show temp and humidity first. If you don't # want to do this, change the line below to sensor_data. sensor_data[sensor_data.columns[::-1]] -
When Streamlit detects that a source file has changed, it will notify you with a message in the top-right corner. Click "Rerun" or "Always Rerun" to reload the app.

-
After the page reloads, you'll see a table view of your Sensor data from Snowflake.

-
Now let's add a chart of temperature and humidity data over time, using the Streamlit
line_chartfeature.if show_charts: """ ### Environment Chart """ sensor_group = sensor_data[["Temp", "Humidity"]] st.line_chart(sensor_group) -
When the page reloads, you'll see a line chart of temperature and humidity readings.

-
Finally, add a map using the Streamlit
mapAPI.if show_map: """ ### Tracker Map """ sensor_locations = sensor_data[["lat", "lon"]] st.map(sensor_locations) -
When the page reloads, check the "Show map?" checkbox and you'll see a map of device locations.

Next Steps
Congratulations! You've created your first Route and connected your Notecard app to an external service. If you're following the Cell+WiFi Quickstart, you're done!
Now that you know the basics of how Notecard and Notehub work, you’re ready to apply what you’ve learned towards a real project. We have a few recommendations on what to do next:
-
Learn Best Practices for Production Projects: This skimmable guide has a list of best practices for moving your project from a prototype to a real, production-ready deployment.
-
Browse Example Apps: Our collection of IoT apps that show how to build common projects with Blues. These example apps include dozens of official Blues project accelerators, a collection of purpose-built sample apps, and a huge set of projects from our community.
-
Follow the Notehub Walkthrough: Learn how to manage projects and device fleets, update Notecard and host firmware, set up alerts, securely route your data, and more.
At any time, if you find yourself stuck, please reach out on the community forum.